
Figure 3.
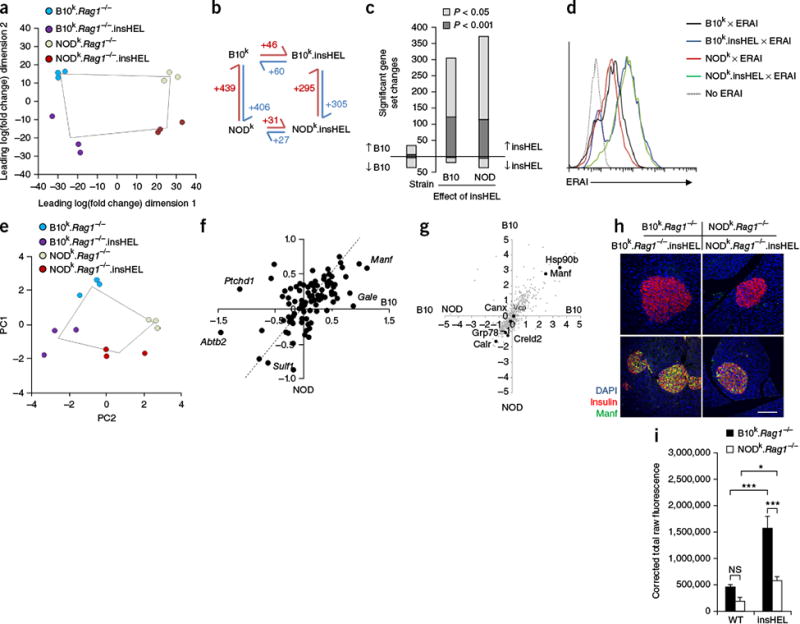
Qualitative rather than quantitative differences in the UPR on the B10 and NOD backgrounds. (a) Globa principal-components analysis (PCA) of RNA-seq data for islets (n = 3 mice/group). (b) Schematic of the number of significant (corrected P < 0.05) gene expression differences for pairs of sample conditions. (c) Number of significant gene set changes in gene set enrichment analysis (GSEA) using cutoffs of P < 0.05 and P < 0.001. (d) ERAI mice were crossed to B10k.Rag1−/−.insHEL and NODk.Rag1−/−.insHEL mice, and islets were analyzed by flow cytometry. Histograms show Xbp1s (Venus) expression in insulin-expressing beta cells. Results are representative of three experiments. (e) PCA of the Xbp1 response gene set in islets (n = 3 mice/group). (f) Scatterplot of individual Xbp1 response genes, showing the average log2-transformed fold change in expression induced by insHEL on the B10 background versus the NOD background. The dashed line indicates equivalent regulation; outlier genes are annotated. (g) Dot plot of mass spectrometry expression ratios, showing on each axis the log2-transformed ratio of expression in B10k.Rag1−/−.insHEL islets as compared to NODk.Rag1−/−.insHEL islets in duplicate experiments. All reproducibly detected proteins are displayed in gray, with black dots indicating annotated UPR-related proteins. (h,i) Immunofluorescence of wild-type and insHEL transgenic islets with a polyclonal antibody to insulin, antibody to Manf and DAPI. Staining is representative of three experiments (h), with Manf quantification (n = 10 mice/group) (i). Scale bar, 100 μm. Data are shown as means ± s.e.m. *P < 0.05, ***P < 0.0001. NS, not significant.