
Figure 5.
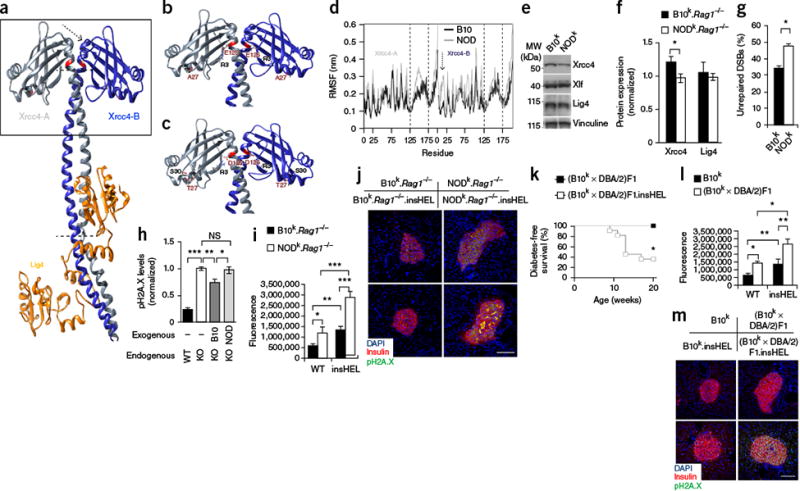
Xrcc4 mutation drives enhanced susceptibility to senescence. (a) Three-dimensional structure of the Lig4 complex, determined using the human structure as scaffolding. Modified residues are highlighted in red, and the arrow and dotted lines indicate regions of major instability. The box highlights the regions shown in detail in b and c. (b,c) Molecular interactions calculated along the represented trajectory for the B10 (b) and NOD (c) alleles of Xrcc4. (d) Per-residue root-mean-square fluctuation (RMSF) in Xrcc4 between 70–100 ns of simulation. Regions with a different fluctuation profile are highlighted by the dashed lines and one arrow, corresponding to the regions indicated in a. The results are representative of four simulations. (e,f) Representative immunoblotting of mouse embryonic fibroblasts (MEFs) for Xrcc4, Xlf and Lig4 (e), with quantification (n = 5 technical replicates/group) (f). (g) Proportion of MEFs that remained positive for H2A.X (Ser139) phosphorylation (pH2A.X; indicative of DSBs) after etoposide exposure (n = 6 technical replicates/group). (h) Wild-type CHO cells and Xrcc4-deficient (KO) CHO cells reconstituted with the B10 or NOD Xrcc4 allele were exposed to etoposide, and unrepaired DNA damage was quantified (n = 6–8 technical replicates/group). (i,j) Immunofluorescence with a polyclonal antibody to insulin, antibody to phosphorylated H2A.X and DAPI on pancreata from the B10k.Rag1−/− and NODk.Rag1−/− backgrounds. Quantification is shown for islet raw fluorescence in the channel for phosphorylated H2A.X (n = 19, 17, 20 and 20 sections) (i), with images of representative sections (j). Scale bar, 100 μm. (k) Diabetes incidence of (B10k × DBA/2)F1 and (B10k × DBA/2)F1.insHEL mice (n = 6 and 11 mice). (l,m) Immunofluorescence with a polyclonal antibody to insulin, antibody to phosphorylated H2A.X and DAPI on pancreata from the B10k and (B10k × DBA/2)F1 backgrounds. Quantification is shown of islet raw fluorescence in the channel for phosphorylated H2A.X (n = 19, 17, 16 and 20 sections) (l), with images of representative sections (m). Scale bar, 100 μm. Data are shown as means ± s.e.m. *P < 0.05, **P < 0.01, ***P < 0.0001; NS, not significant.