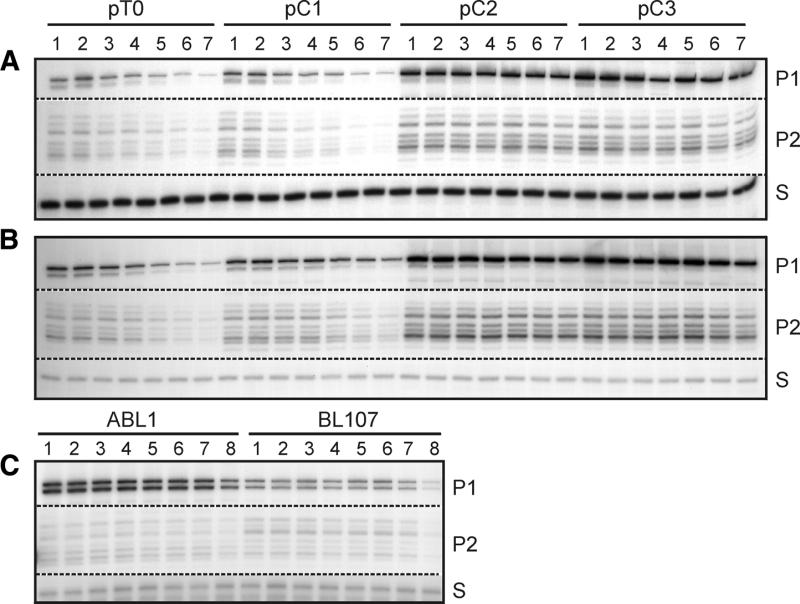
Figure 6.
Stability of mutant rRNA transcripts in vivo. RNA was isolated after rifampicin addition and analysed by primer extension. (A and B) RNA from transformed HB101 cells at 37 and 30°C, respectively. The corresponding plasmids are indicated at the top. Products derived from rRNA promoters P1 and P2 are shown. S, an external standard. Numbers indicate time in seconds after rifampicin addition (lanes 1–8: 0, 20, 40, 60, 80, 150, 300 and 900 s). (C) Analysis of RNA from the plasmid-free RNase III– strains ABL1 and BL107.

