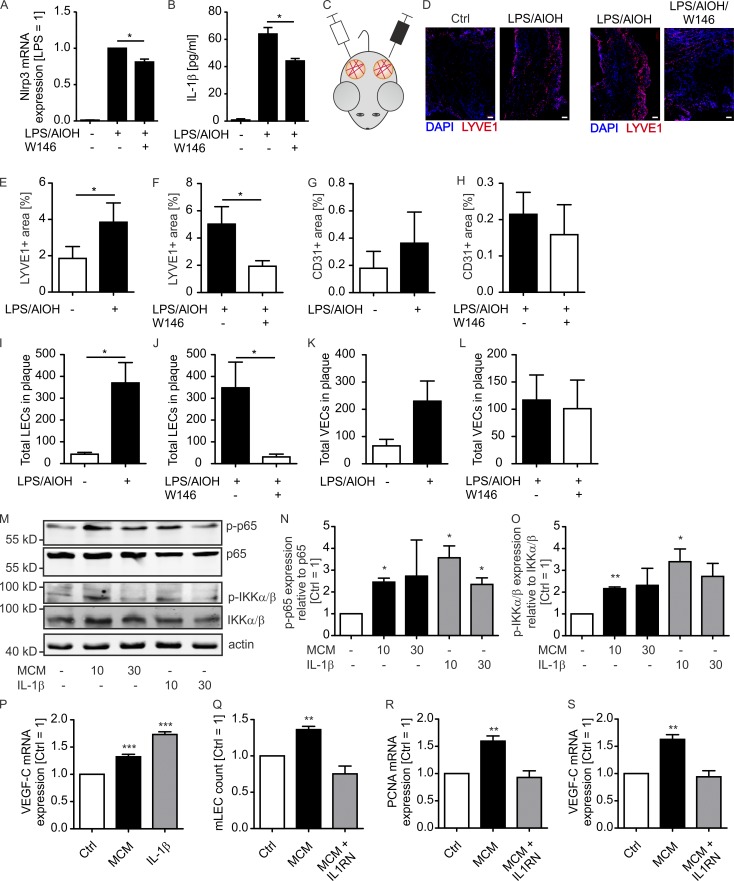
Figure 5.
S1PR1-dependent IL-1β formation by mouse macrophages promotes lymphangiogenesis in vivo. (A and B) Mouse BMDM were incubated with 100 ng/ml LPS, 100 µg/ml AlOH, and 1 µM S1PR1 antagonist W146 and washed after 2 h. (A) NLRP3 expression was determined by quantitative PCR (n = 3 independent experiments). Data are means + SEM. P-values were calculated using one-sample t test. *, P < 0.05. (B) IL-1β in supernatants was analyzed by CBA after 24 h (n = 3 independent experiments). Data are means + SEM. P-values were calculated using one-way ANOVA with Bonferroni’s correction. *, P < 0.05. (C–L) Supernatants of control versus LPS/AlOH-stimulated (D–F, I, and J) or LPS/AlOH-stimulated versus LPS/AlOH/W146-stimulated (D, G, H, K, and L) mouse BMDM mixed with Matrigel were implanted into alternate flanks of five WT mice each and maintained for 10 d. Two individual experiments using two or three animals were performed. (C) Schematic representation of experimental design. (D) Representative confocal microscopy images of LYVE1-expressing cells (nuclei stained with DAPI). Bars, 100 µm. (E–H) Quantification of LYVE1- and CD31-positive area. Data are means + SEM. P-values were calculated using nonparametric two-tailed Student’s t test. *, P < 0.05. (I–L) Matrigel was digested and VEC and LEC were quantified by flow cytometry. Data are means + SEM. P-values were calculated using nonparametric two-tailed Student’s t test. *, P < 0.05. (M–P) Mouse LECs isolated from lungs were stimulated with 10 ng/ml mouse recombinant IL-1β or supernatants of macrophages for 10 or 30 min (M–O) or 24 h (P). To generate macrophage supernatants, macrophages were stimulated with supernatants of PyMT mammary carcinoma cells for 3 h, followed by medium replacement and harvesting of macrophage supernatants after another 21 h. (M–O) Western blots show NF-κB-p65 and IKKα/β expression and phosphorylation. Representative Western blot images (M) and quantification of three independent experiments (N and O) are displayed. Data are means + SEM. P-values were calculated using one-sample t test *, P < 0.05. (P) VEGF-C expression was determined by quantitative PCR (n = 6 independent experiments). (Q–S) Mouse LECs were stimulated with macrophage supernatants for 72 h with or without the addition of 100 ng/ml mouse recombinant IL1RN (n = 4 independent experiments). (Q) Cell number was determined using a CASY cell counter, and PCNA (R) and VEGF-C (S) expression was determined by quantitative PCR. Data are means + SEM. P-values were calculated using one-sample t test. **, P < 0.01; ***, P < 0.001.

