Figure 7.
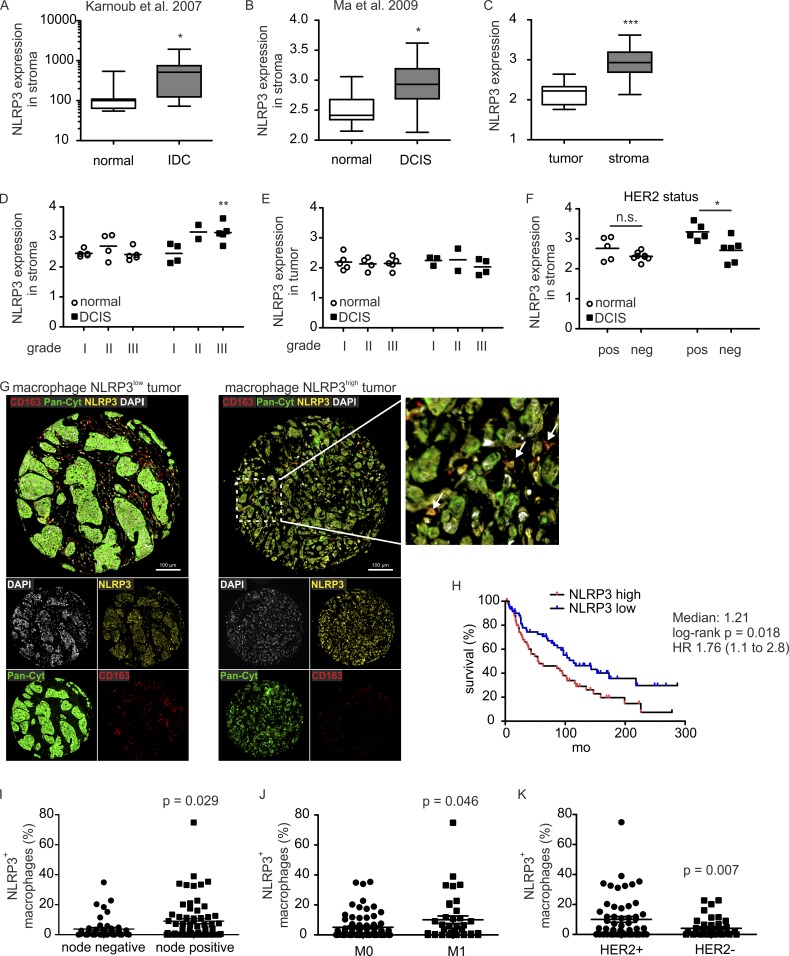
NLRP3 expression in macrophages correlates with clinical parameters. Datasets of previous studies, Karnoub et al. (2007) (A) and Ma et al. (2009) (B–F), were analyzed regarding NLRP3 expression using GEO2R. (A and B) Expression of NLRP3 in normal tissue (A, n = 15; B, n = 14) compared with inflammatory ductal carcinoma (n = 7; A) or DCIS (n = 11; B) stroma. P-values were calculated using two-tailed Student’s t test. *, P < 0.05. (C) NLRP3 expression in tumor (n = 9) versus stromal (n = 11) cells. P-values were calculated using two-tailed Student’s t test. ***, P < 0.001. (D and E) NLRP3 expression correlated to tumor grade in unaffected (normal) compared with DCIS stroma (D) and epithelial (tumor; E) cells. P-values were calculated using two-way ANOVA with Bonferroni’s correction. **, P < 0.01. (F) NLRP3 expression relative to HER2 status in normal compared with DCIS stroma. P-values were calculated using two-way ANOVA with Bonferroni’s correction. n.s., not significant; *, P < 0.05. (G–K) Human CBCTR progression tissue microarrays were analyzed for correlation of macrophage NLRP3 expression with clinical parameters. 111 individual tissue cores of invasive human breast cancer were analyzed. (G) Representative microscopy images show cells expressing CD163, pan-cytokeratin (Pan-Cyt), and NLRP3 in mammary carcinoma cores. Nuclei were stained with DAPI. Bars, 100 µm. NLRP3-expressing macrophages (CD163+) are marked by arrows. (H) Survival rates of patients containing low or high numbers of NLRP3-expressing macrophages were compared. P-value was calculated using log-rank test. (I–K) Percentage of NLRP3+ macrophages relative to nodal status (I), occurrence of distant metastasis (M0, no metastasis; M1, metastasis; J), and HER2 status (K) are shown. P-values were calculated using two-tailed Student’s t test.

