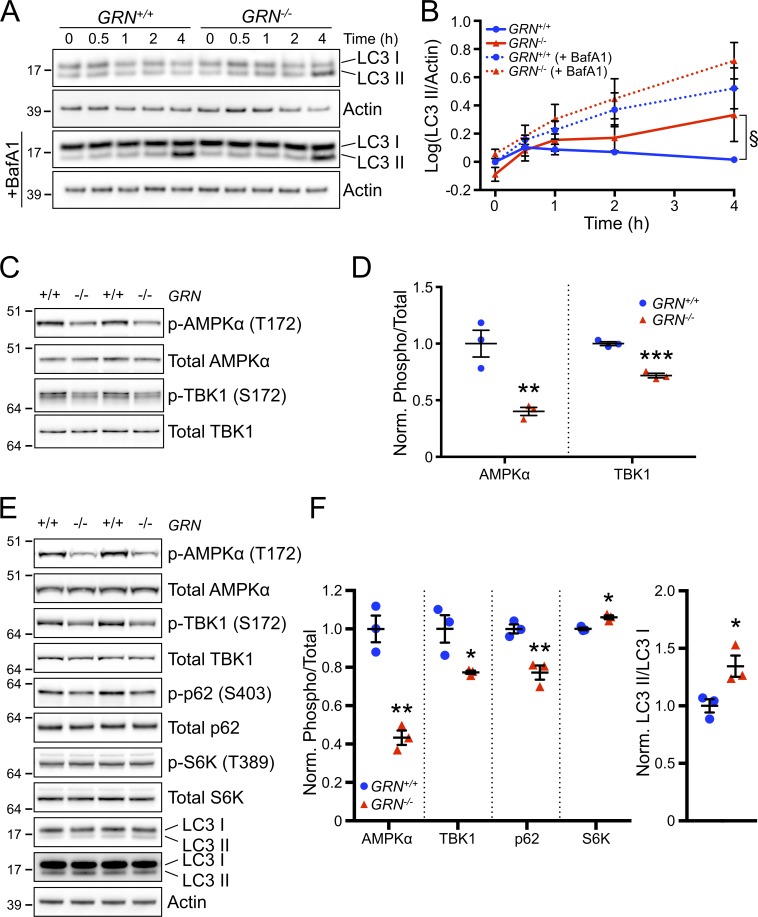
Figure 4.
Impaired autophagy and autophagy signaling in GRN−/− neurons. (A) Representative Western blot from n = 3 independent experiments of cell lysates from GRN+/+ and GRN−/− cortical neurons starved for the indicated times in the absence (top rows) or presence (bottom) of 100 nM bafilomycin A1 and probed for LC3 and actin. (B) Quantification of LC3 II levels from experiments as in A. n = 3 independent experiments. §, P = 0.038 for GRN−/− versus GRN+/+ using two-way ANOVA and Dunnett’s multiple comparisons test (0.5 h = not significant [n.s.], 1 h = P < 0.05, 2 h = P < 0.01, and 4 h = P < 0.0001). (C) Representative Western blot from n = 3 independent experiments of cell lysates from cultured GRN+/+ and GRN−/− cortical neurons probed with the indicated antibodies. (D) Quantification of phosphorylated/total signal for AMPK and TBK1 from experiments as shown in C. n = 3 independent experiments. **, P < 0.01 and ***, P < 0.001 versus GRN+/+ using unpaired t test. (E) Representative Western blot of whole cortex from ∼18-mo-old GRN+/+ and GRN−/− mice probed with the indicated antibodies. n = 3 mice per group from one experiment. (A, C, and E) Molecular mass is indicated in kilodaltons. (F) Quantification of phosphorylated/total signals for the indicated proteins (left) and LC3 II/LC3 I signal (right) from experiments as shown in E. n = 3 mice per group from one experiment. *, P < 0.05 and **, P < 0.01 using an unpaired t test. Error bars represent mean ± SEM.

