Figure 1.
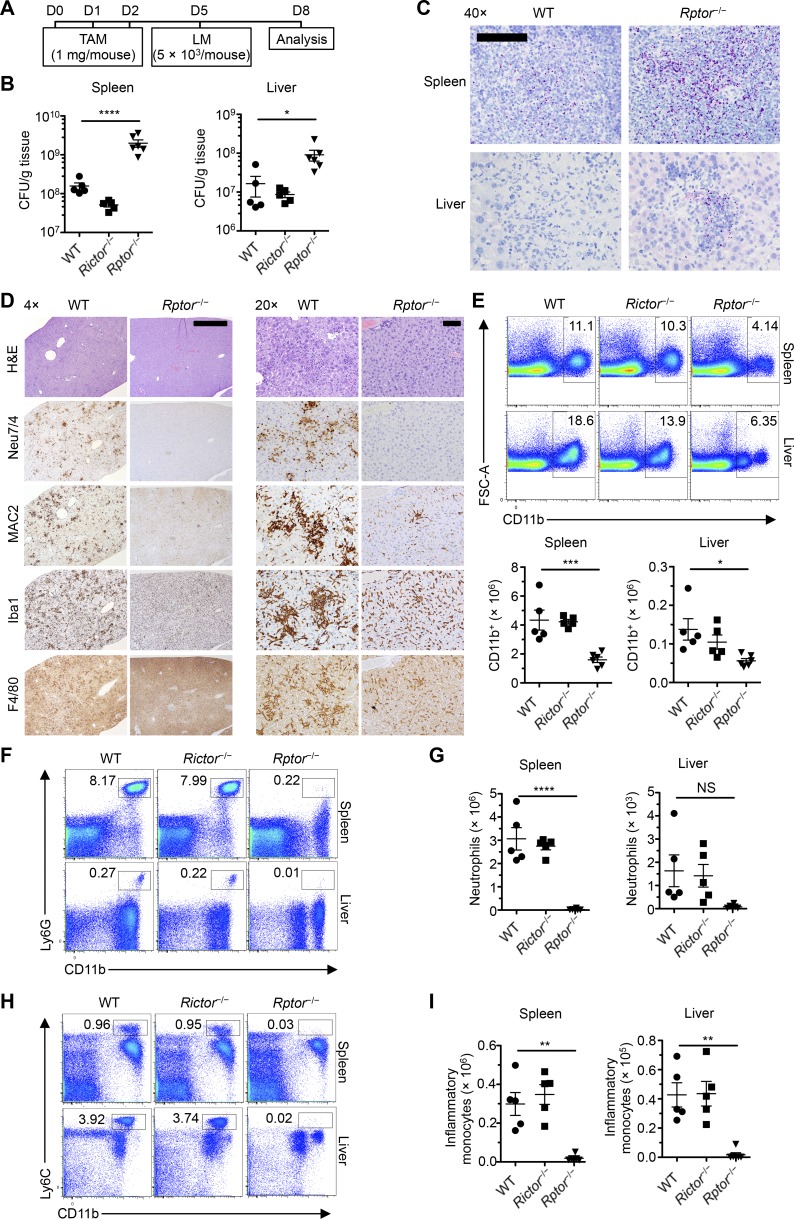
Hematopoietic Rptor ablation renders mice susceptible to L. monocytogenes infection. (A) Scheme of experimental design of tamoxifen (TAM) treatment and L. monocytogenes infection. (B) Total colony-forming units of L. monocytogenes per gram of tissue in WT, Rictor−/−, and Rptor−/− mice (n = 5 mice per group). (C) Immunohistochemistry for L. monocytogenes antigen in the spleen and liver tissues from WT and Rptor−/− mice (n = 4–5 mice per group). Bar, 0.1 mm. (D) Hematoxylin and eosin staining for general pathology and immunohistochemical detection of neutrophils (Neu7/4) and macrophages (MAC2, Iba1, and F4/80) in the liver of WT and Rptor−/− mice (n = 4–5 mice per group). Bars: (left) 1.0 mm; (right) 400 µm. (E) Flow cytometry analysis and numbers of CD11b+ myeloid cells in the spleen and liver of WT, Rictor−/−, and Rptor−/− mice (n = 5 mice per group). (F) Flow cytometry analysis of neutrophils (CD11b+Ly6G+) in spleen and liver of WT, Rictor−/−, and Rptor−/− mice (n = 5 mice per group). (G) Number of neutrophils in spleen and liver of WT, Rictor−/−, and Rptor−/− mice (n = 5 mice per group). (H) Flow cytometry analysis of inflammatory monocytes (CD11b+Ly6C+) in spleen and liver of WT, Rictor−/−, and Rptor−/− mice (n = 5 mice per group). (I) Number of inflammatory monocytes in spleen and liver of WT, Rictor−/−, and Rptor−/− mice (n = 5 mice per group). Numbers indicate percentages of cells in gates. Data are mean ± SEM and representative of four (E–I) or two (B–D) independent experiments. *, P < 0.05; **, P < 0.01; ***, P < 0.001; ****, P < 0.0001; NS, not significant; one-way ANOVA with Dunnet’s post hoc test.

