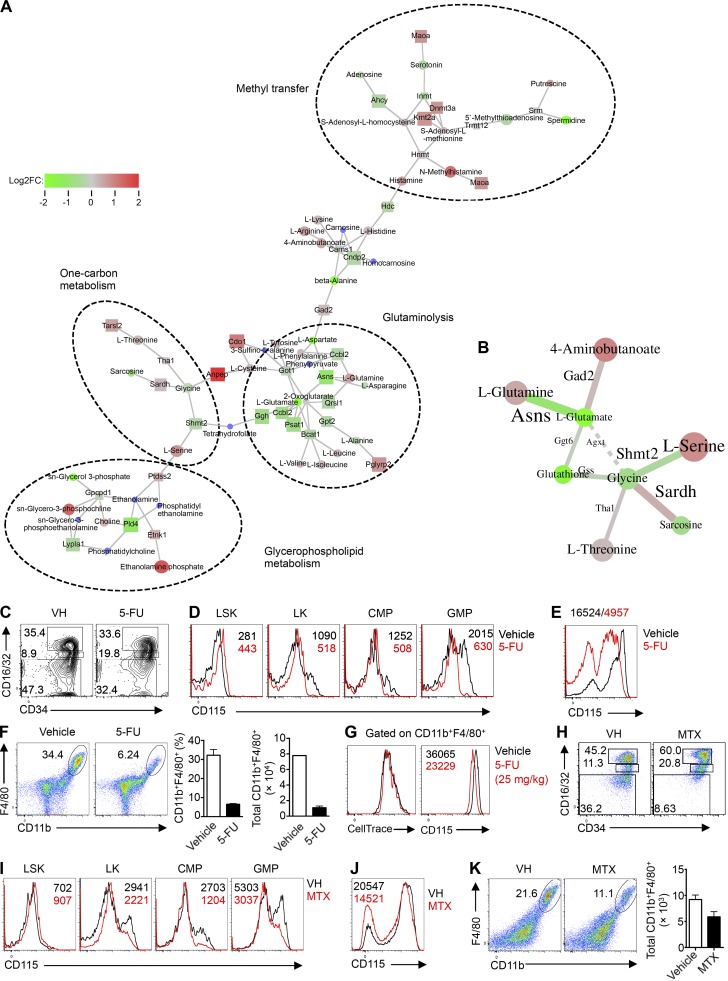
Figure 7.
mTORC1 regulates one-carbon metabolism to support myelopoiesis. (A) GAM analysis of nodes (n = 3–4 mice per group). (B) GAM analysis of optimally solved edges (n = 3–4 mice per group). (C) Flow cytometry analysis of CD16/32 and CD34 on BM Lin– LK cells from mice treated with vehicle (PBS) and 5-FU (25 mg/kg). (D) Expression of CD115 on myeloid progenitor cell populations from mice treated with vehicle (PBS) and 5-FU, with mean fluorescence intensity (MFI) plotted within graphs. (E) Expression of CD115 on Lin– BM cells from mice treated with vehicle (PBS) and 5-FU after liquid culture with M-CSF (10 ng/ml) for 2 d, with MFI plotted above graph. (F) Flow cytometry analysis (left) of F4/80 and CD11b, frequency (middle), and number (right) of CD11b+F4/80+ in Lin– BM cells from mice treated with vehicle (PBS) and 5-FU after liquid culture with M-CSF (10 ng/ml) for 2 d. (G) Flow cytometry analysis of CellTrace (left) and CD115 (right) within the gated CD11b+F4/80+ cells from cultured (M-CSF, 10 ng/ml, 2 d) Lin– BM cells from mice treated with vehicle (PBS) and 5-FU, with MFI plotted within graphs. (H) Flow cytometry analysis of CD16/32 and CD34 on BM Lin– LK cells from mice treated with vehicle (DMSO) and MTX (32 mg/kg). (I) Expression of CD115 on myeloid progenitor cell populations from mice treated with vehicle (DMSO) and MTX, with MFI plotted within graphs. (J) Expression of CD115 on Lin– BM cells from mice treated with vehicle (DMSO) and MTX after culture with M-CSF (10 ng/ml) for 2 d, with MFI plotted within graph. (K) Flow cytometry analysis (left) of F4/80 and CD11b and number (right) of CD11b+F4/80+ cells in Lin– BM cells from mice treated with vehicle (DMSO) and MTX after culture with M-CSF (10 ng/ml) for 2 d. Numbers indicate percentage of cells in gates. Data are mean ± SEM. Data are one experiment (A and B) or representative of three experiments (C–K).

