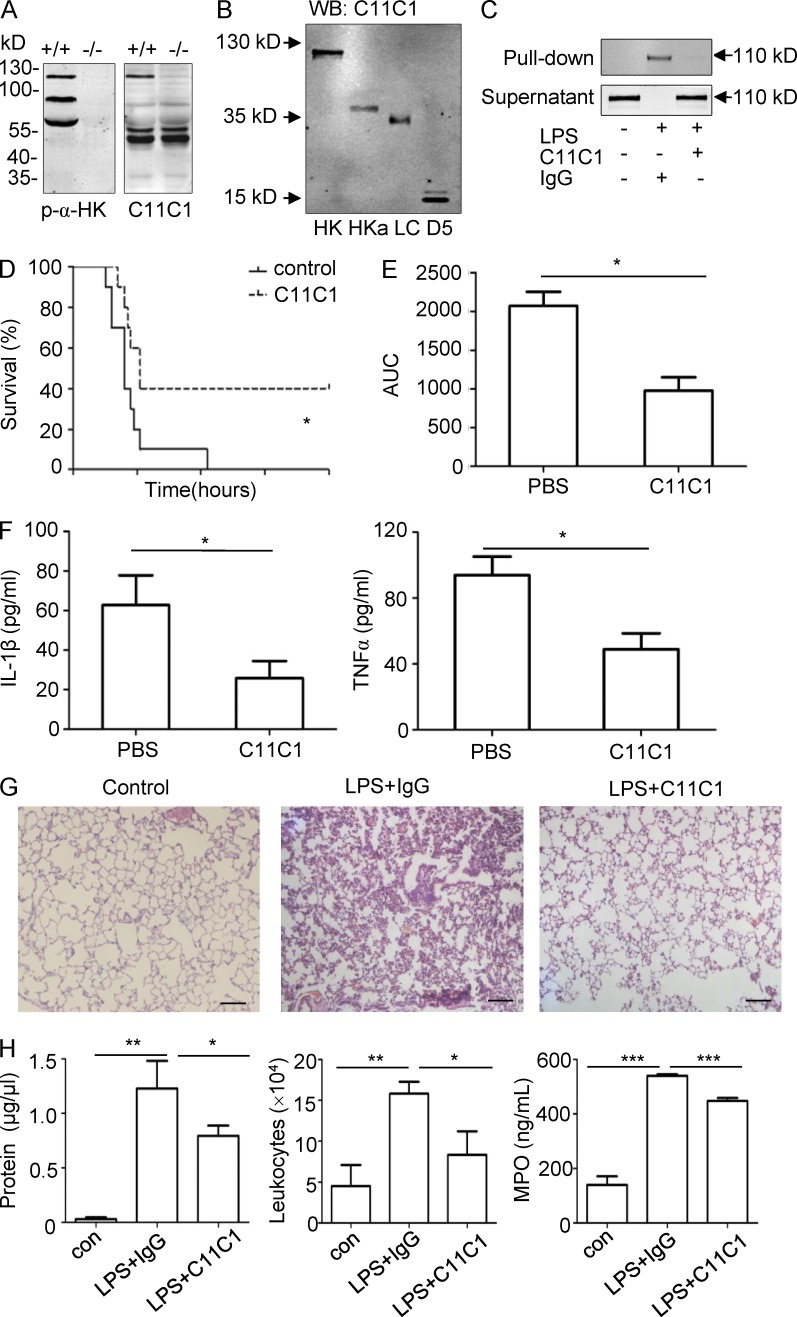
Figure 9.
The mAb C11C1 against the D5 domain from HK significantly suppresses LPS-induced systemic inflammation in WT mice. (A) Plasma from WT (+/+) mice and Kng1−/− (−/−) mice was separated by SDS-PAGE and analyzed by immunoblotting using either a polyclonal anti-HK Ab (left) or the monoclonal C11C1 antibody (right), respectively. (B) 50 ng HK, HKa, LC, or D5 was separated by SDS-PAGE and detected by immunoblotting using the C11C1 mAb. (C) Diluted mouse plasma was preincubated with 30 µg/ml of C11C,1 or an isotype control mouse IgG, followed by incubation with 20 µg/ml of LPS. LPS and its associated proteins were then pull-downed using polymyxin B beads. The proteins associated with the beads and remaining in the supernatant were analyzed by immunoblotting with the C11C1 mAb. Data are representative of three independent experiments. (D) Two groups of 8-wk-old WT C57BL/6 mice (n = 12) received an i.v. injection of mouse IgG (mIgG) or C11C1 antibody at 40 mg/kg. After 15 min, both groups of mice received an i.p. injection of LPS (25 mg/kg), and the survival rate was monitored. Data were analyzed using a log-rank test and are representative of two independent experiments. *, P < 0.05. (E and F) Two groups of WT C57BL/6 mice (n = 8) received an injection of mIgG or C11C1 antibody at 40 mg/kg before receiving an i.p. injection of 5 mg/kg of LPS. Blood was collected at 0, 3, 6, 12, and 24 h after LPS injection, and the endotoxin kinetics were measured and the AUC was calculated. The levels of IL-1β and TNF in blood collected at 6 h were measured by ELISA (F). Data were analyzed using an unpaired Student's t test and are representative of two independent experiments. *, P < 0.05. Data are expressed as mean ± SEM. (G) 24 h after LPS challenge, the lung was removed, fixed, and stained with hematoxylin and eosin stain, and the images are shown. Bars, 100 μm. (H) 24 h after LPS challenge, BALF was collected and its total protein concentration and white blood cell content were determined. The MPO activity in the lung homogenate was also measured. Statistics were analyzed using an ANOVA. *, P < 0.05; **, P < 0.01; ***, P < 0.001. Data are representative of two independent experiments and expressed as mean ± SEM.

