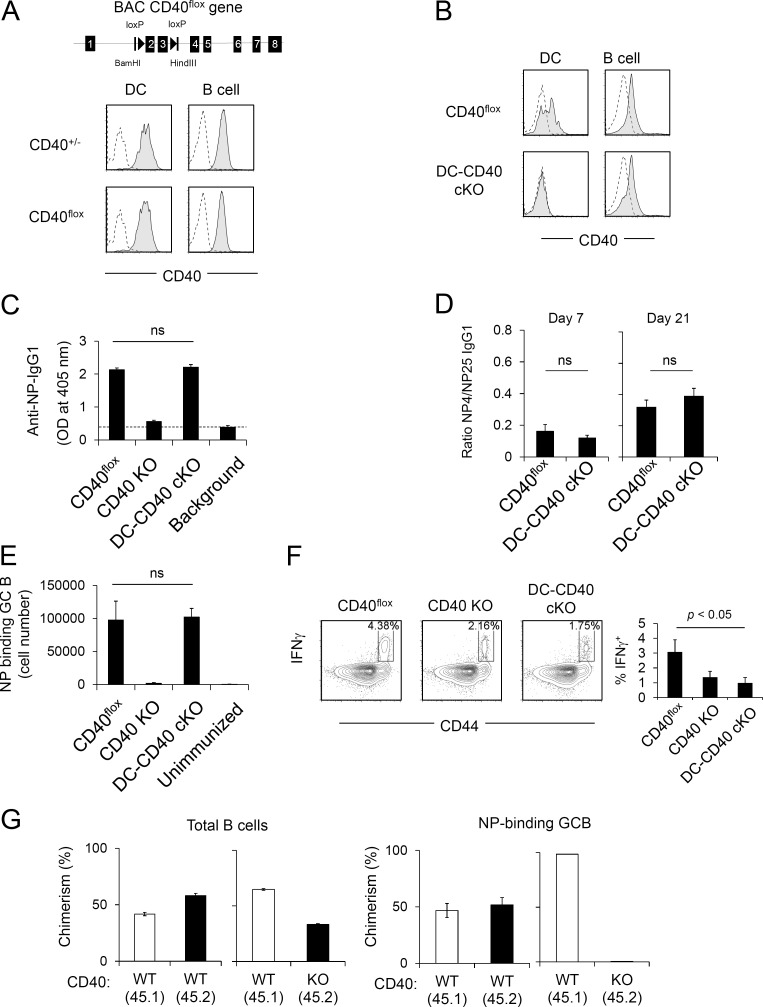
Figure 4.
CD40 on B cells but not DCs is required for TD antigen–specific IgG production. (A) Generation of CD40flox mice. Exons 2 and 3 of the CD40 gene on BAC were floxed by loxP sites (top). CD40flox BAC Tg mice were backcrossed to CD40 KO mice to eliminate endogenous CD40 expression. CD40flox BAC Tg expression on LPS-stimulated DCs and B cells is shown. (B) CD40 expression on LPS-stimulated splenic DCs and B cells of CD40flox, CD40flox × CD11c-Cre Tg (DC-CD40 cKO), and CD40 KO mice. Splenocytes were stimulated with LPS for 48 h, and CD40 expression on B cells (B220+) and DCs (CD11c+) was analyzed by flow cytometry. Filled histograms show anti-CD40 antibody staining of CD40flox or DC-CD40 cKO DCs and B cells. Dashed lines show anti-CD40 antibody staining of CD40 KO. (A and B) Data are representative of four independent experiments. (C) Antigen-specific IgG1 production of DC-CD40 cKO mice. Mice were immunized with NP-KLH/Alum, and serum was collected after 3 wk. Serum titer of anti-NP IgG1 was determined by ELISA. Dashed line indicates background OD value in empty wells. Data are combined results of four independent experiments. The total numbers of mice in the four combined experiments are CD40flox, n = 8; CD40 KO, n = 7; and DC-CD40 cKO, n = 6. ns, not significant. (D) Antibody affinity maturation was determined by the ratio of high-affinity NP-specific IgG1 to total NP-specific IgG1 in serum at 7 and 21 d after immunization. The total numbers of mice in the three combined experiments are CD40flox, n = 8; and DC-CD40 cKO, n = 6. (E) Mice were immunized with NP-KLH/Alum. At day 8 after immunization, the absolute number of NP-specific GC B cells (B220+ GL7+ CD38dull NP-PE+) in the spleen was determined by flow cytometry. (D and E) Data presented are the combined result of three independent experiments. The total numbers of mice in the three combined experiments are CD40flox, n = 4; CD40 KO, n = 4; DC-CD40 cKO, n = 5; and unimmunized, n = 3. (F) Ex vivo IFN-γ production of purified splenic CD4+ T cells after stimulation with PMA and ionomycin for 2 h. Representative FACS plots are shown. The graph is a combined result of three independent experiments. The total numbers of mice in the three combined experiments are n = 3 for each strain. (G) WT (CD45.1) + CD40 KO (CD45.2) mixed BM chimera mice were immunized with NP-KLH/Alum, and NP-specific GC B cells were analyzed 1 wk later. Each group, n = 4. Data are representative of two independent experiments. Statistical significance was determined by Student’s t test. All error bars represent means ± SEM.

