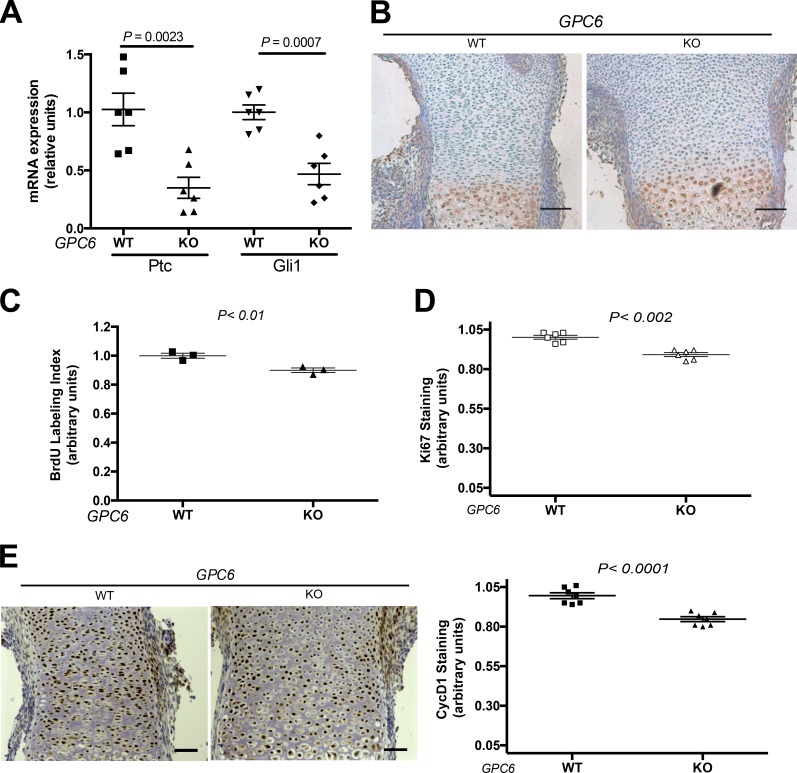
Figure 3.
GPC6-null femurs display reduced Hh signaling and chondrocyte proliferation. (A) Comparison of the levels of Ptc1 and Gli1 in E15.5 femurs. Ptc1 and Gli1 transcripts were measured by real-time RT-PCR using β-actin transcript levels as references. A total of six GPC6 WT and six GPC6-null (KO) femurs dissected from four litters of E15.5 embryos were analyzed. Mean WT value for each litter was arbitrarily considered as 1, and the relative levels of expression of the KOs were calculated. Scatter plots show the mean + SEM. (B) Immunohistochemical analysis of Ihh in E15.5 femur sections. Staining was performed in three littermate pairs of KO and WT embryos and one pair of KO and heterozygous embryos from three different litters. A representative result is shown. Bars, 100 µm. (C) BrdU labeling index of growth plates from femur sections dissected from E15.5 embryos. The results represent the mean + SEM of pairs of WT and KO mice from three different litters. The mean percentage of WT sections was defined as 1. All the nuclei in each femur section were counted (from 370 to 650 nuclei). Scatter plots show the mean ± SEM. (D) Immunohistochemical analysis of Ki67 in E15.5 femur growth plate sections. The percentage of positive cells was calculated. The results represent the mean ± SEM of pairs of WT and KO mice from three different litters. All the nuclei in each femur section were counted (from 370 to 650 nuclei). The mean percentage of WT sections was defined as 1. Scatter plots show the mean ± SEM. (E) Immunohistochemical analysis of cyclin D1 in E15.5 femur growth plate sections. Staining was performed in three pairs of KO and WT embryos from three different litters. (Left) A representative result is shown. Bars, 50 µm. (Right) Percentage of positive cells was calculated. The results represent the mean ± SEM of pairs of WT and KO mice from three different litters. All the nuclei in each femur section were counted (from 370 to 650 nuclei). The mean percentage of WT sections was defined as 1. Statistical analysis was performed by Student’s t test (unpaired two-tailed).

