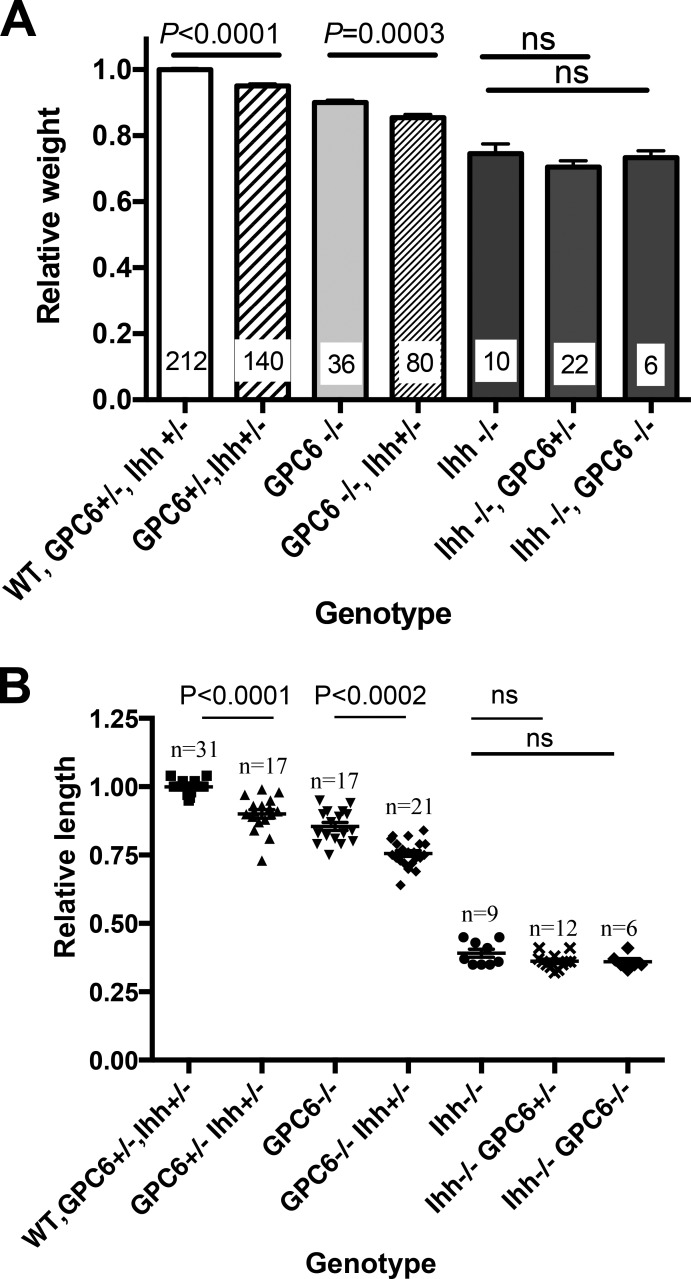
Figure 4.
Genetic interaction between GPC6 and the Hh signaling pathway. (A) GPC6/Ihh double-heterozygous mice were bred, and all E17.5 embryos from each litter were weighed and genotyped. To be able to compare embryos from different litters, the weight of embryos within a given litter was normalized by the mean weight of WT embryos, which was arbitrarily given a value of 1. Bars represent the mean weight + SEM for the indicated genotypes. The first bar at the right includes mice with the three different genotypes that display normal weight: GPC6+/+ Ihh+/+, GPC6+/− Ihh+/+, and GPC6+/+ Ihh+/−. Numbers on the bars represent the number of embryos that were weighted for each genotype. (B) Femurs from some of the litters generated by breeding the GPC6/Ihh double-heterozygous mice were dissected, and their length was measured as described in Fig. 2. Scatter plots with the mean ± SEM of the indicated number of embryos are shown. Mean WT femur length in each litter was arbitrarily assigned the value of 1. Statistical analysis was performed by Student’s t test (unpaired two-tailed).

