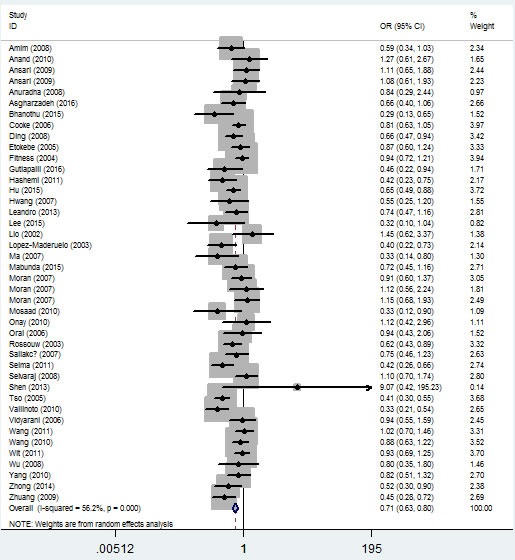
Figure 4. Forest plot of tuberculosis risk associated with IFNG +874 T/A (rs2430561) polymorphism (the allelic effect) by ethnicity.

The squares and horizontal lines correspond to the study-specific OR and 95% CI. The area of the squares reflects the weight (inverse of the variance). The diamond represents the summary OR and 95% CI.
