Figure 3.
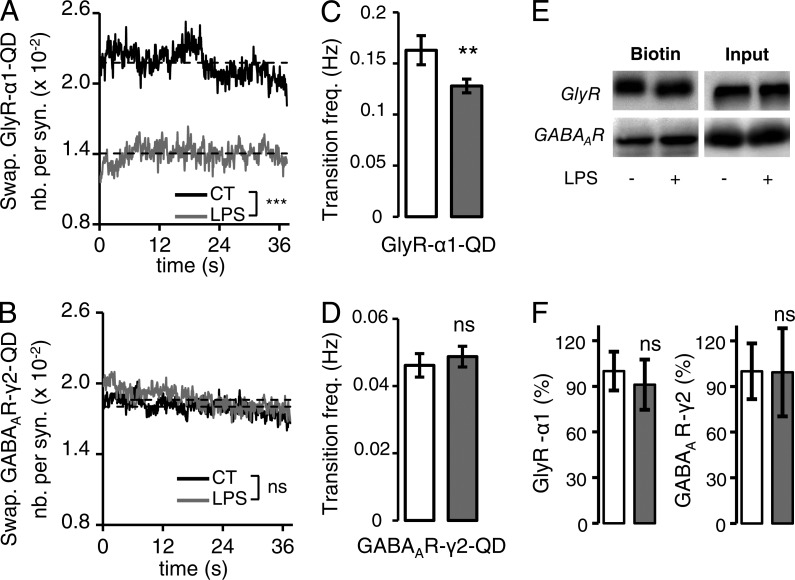
Short-term stimulation of microglia decreases the proportion of synaptic swapping trajectories. (A and B) SC of swapping GlyR α1 (A) and GABAAR γ2 (B) in control (black) and after LPS application (gray). (C and D). Transition frequency of GlyR α1 QDs (C) and GABAAR γ2 QDs (D) in and out of the synapses. Mean ± SEM; ns, P > 0.05; **, P < 0.01; t test. (E) Representative Western blots of GlyR α1 and GABAAR γ2 in the total amount of protein (input) or in the biotinylated fraction at the cell surface (biotin) in control of LPS-treated cells. (F) Mean ratio (±SEM) of surface-to-total GABAAR γ2 and GlyR α1 levels in control condition (white) and after LPS application (gray). Data are expressed as a percentage of control (n = 5 and 4 cultures, respectively; ns, P > 0.05; t test).

