
Figure 11.
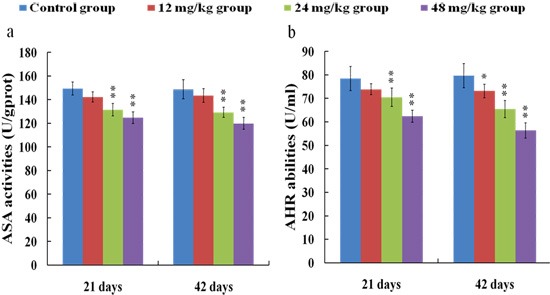
Changes of ASA (a) and AHR (b) abilities in the kidney at 21 and 42 days of the experiment. Data are presented with the means ± standard deviation (n = 8). *p < 0.05, compared with the control group; **p < 0.01, compared with the control group.