
Figure 5.
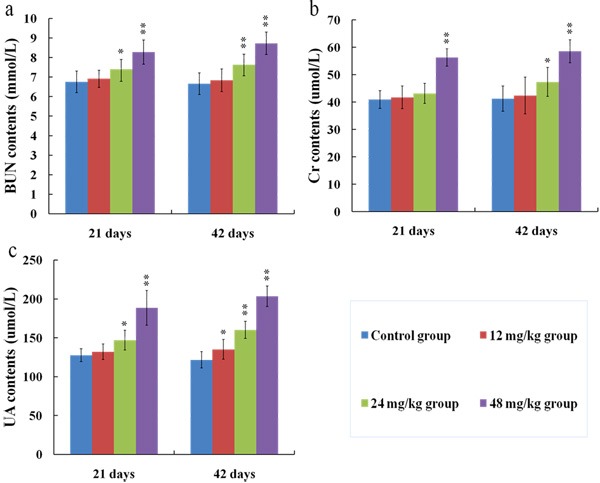
Changes of BUN (a), Cr (b) and UA (c) contents in the serum at 21 and 42 days of the experiment. Data are presented with the means ± standard deviation (n = 8). *p < 0.05, compared with the control group; **p < 0.01, compared with the control group.