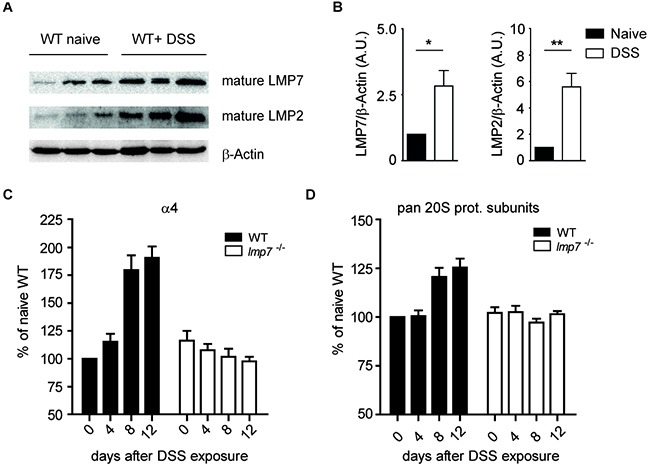
Figure 1. Abundance of proteasomal subunits after treatment of WT mice with DSS.

A. Immunoblot analysis for LMP7 and LMP2 in naïve and DSS-treated mice (day 8 after induction of colitis). β-Actin served as a loading control. A representative of two independent experiments is shown. B. Densitometric quantification of immunoblot analyses for LMP2 and LMP7 expression on day 8 after DSS treatment of WT mice. C and D. Densitometric analysis for protein expression of structural proteasomal subunit α4 and for all pan-20S subunits (MP3 Ab) on indicated days after exposure to 3% DSS. The membranes were stained against GAPDH as loading control. Data represent mean ± SEM. Three independent experiments were performed.
