Figure 5.
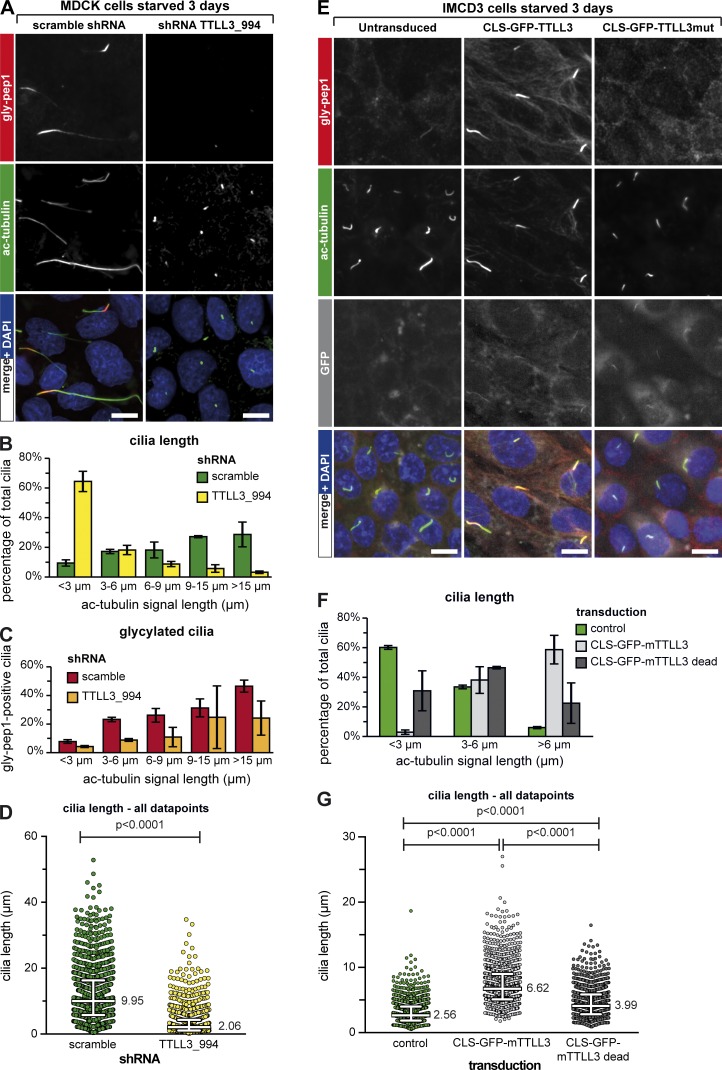
Glycylation regulates ciliary length. (A) MDCK cells were transduced with scrambled or TTLL3-specific shRNA constructs (Fig. S2 A) and serum starved for 3 d. Cilia were stained with ac-tubulin (green) and glycylation with gly-pep1 (red). Note the strong decrease of ciliary length in cells treated with shRNA TTLL3_994. Bars, 10 µm. (B) Quantification of the ciliary length for A. The graphs represent the percentage of cilia for each length category. Each bar represents the mean of three independent experiments (±SD). (C) Percentage of gly-pep1–positive cilia was determined for each of the different length groups and plotted as the mean value of three independent experiments (±SD). (D) Ciliary length measurements from three independent experiments for each experimental condition shown in A are represented as a scatter plot with a line indicating the median (value indicated) and whiskers at interquartile ranges (25th and 75th percentiles). P-values were calculated by one-way ANOVA. Individual experiments are shown in Fig. S3 B. For the number of individual measurements per data point, see Table S1 (n > 1,000). (E) IMCD3 cells were transduced with active or mutant TTLL3 fused to GFP and a CLS and serum starved for 3 d. Cilia were stained with ac-tubulin (green) and glycylation with gly-pep1 (red). GFP is depicted in gray. Note the increase in length of cilia positive for gly-pep1 in cells transduced with active TTLL3. (F) Quantification of the ciliary length in control cells and cells transduced with active or mutant TTLL3 as described in D. In transduced cells, only GFP-positive cilia were considered for analyses. (G) Ciliary length measurements from three independent experiments for each experimental condition shown in E are represented as a scatter plot with a line indicating the median (value indicated) and whiskers at interquartile ranges (25th and 75th percentiles). P-values were calculated by one-way ANOVA. Individual experiments are shown in Fig. S3 C. For the number of individual measurements per data point, see Table S1 (n > 1,100).

