Figure 2.
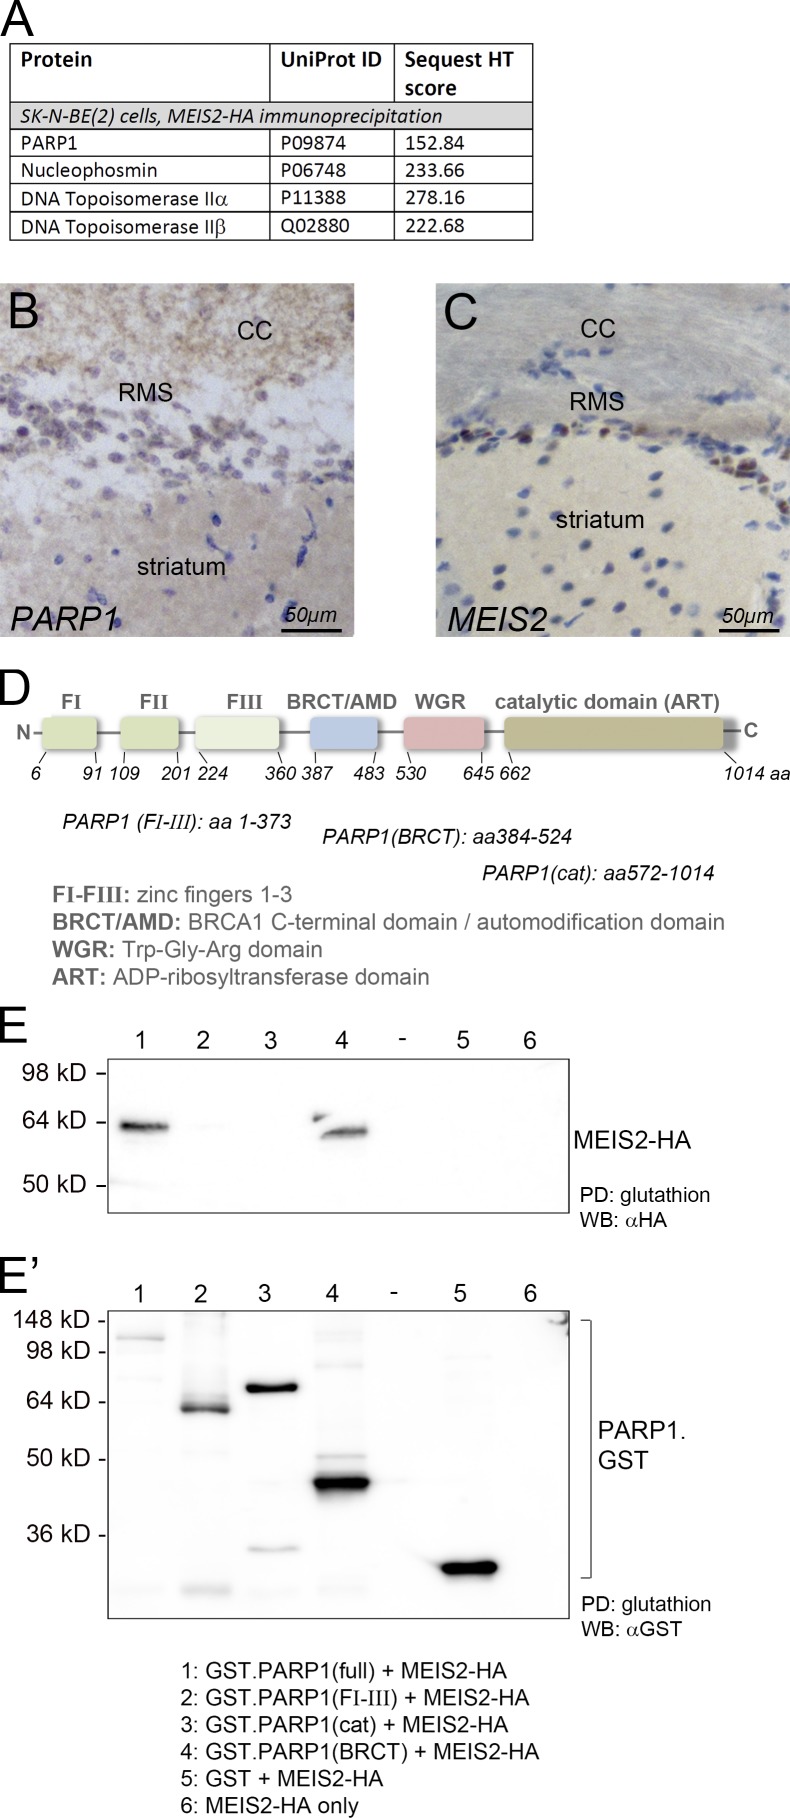
MEIS and PARP1 interact. (A) Mass spectrometry scores of PARP1 and PARP1-interacting proteins copurifying with MEIS2 from nuclear extracts of SK-N-BE(2) neuroblastoma cells. (B and C) PARP1 (B) and MEIS2 (C) protein distribution in the RMS. MEIS2 and PARP1 protein staining is shown in brown, and nuclear counterstaining is in blue. CC, corpus callosum. (D) Domain structure of PARP1. (E) GST pulldown of HA-tagged MEIS2 with different PARP1–GST fusion proteins. The left panel shows a blot probed for HA detecting MEIS2-HA, and the right panel shows the same blot probed for GST detecting the different PARP1–GST fusion proteins. Because transfer of full-length PARP1–GST was incomplete because of its large size, higher-exposure images of the blot probed for HA and GST are shown in Fig. S2. The number of biological replicates performed for E are listed in Table S4. PD, pulldown; WB, Western blot.

