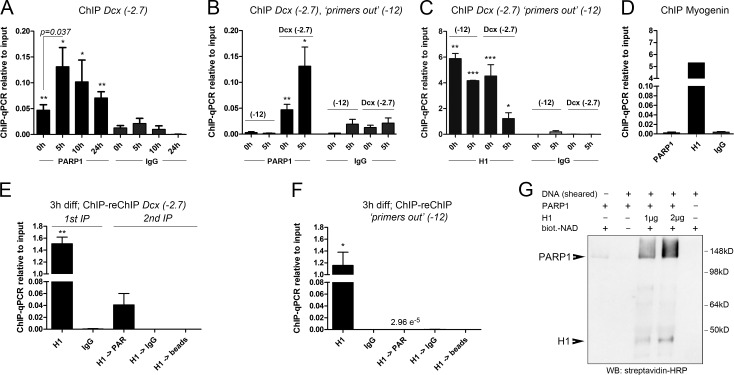
Figure 3.
MEIS recruits PARP1 to the Dcx promoter/enhancer. (A) ChIP-qPCR for PARP1 at Dcx(−2.7) during neuronal differentiation. (B) Comparison of PARP1 binding to Dcx(−2.7) and “primers out” (−12) at 0 and 5 h; values for Dcx(−2.7) correspond with those shown in A. (C) ChIP-qPCR for H1 at Dcx(−2.7) and “primers out” at the times indicated. (D) ChIP-qPCR for PARP1 and H1 at the Myog promoter, showing reciprocal binding of PARP1 and H1. (E and F) ChIP-reChIP for H1 followed by PAR at Dcx(−2.7) (E) and “primers out” (F) at 3 h of differentiation. (G) In vitro PARylation assay of recombinant PARP1 and H1 in the presence of biotinylated (biot.) NAD+ and stimulated by the addition of low-molecular DNA fragments (sheared DNA), demonstrating efficient PARylation of H1 and autoPARylation of PARP1. The asterisks in A–F indicate statistically significant enrichment of ChIP with the antibodies indicated relative to ChIP with the IgG control antibodies for the same conditions, with *, P < 0.05; **, P < 0.01; ***, P < 0.001. Statistical significance of ChIP results between experimental groups is given as p = numerical value. ChIP data are represented as means ± SEM. Samples sizes and the number of biological replicates are listed in Table S4. IP, immunoprecipitation; WB, Western blot.

