Figure 7.
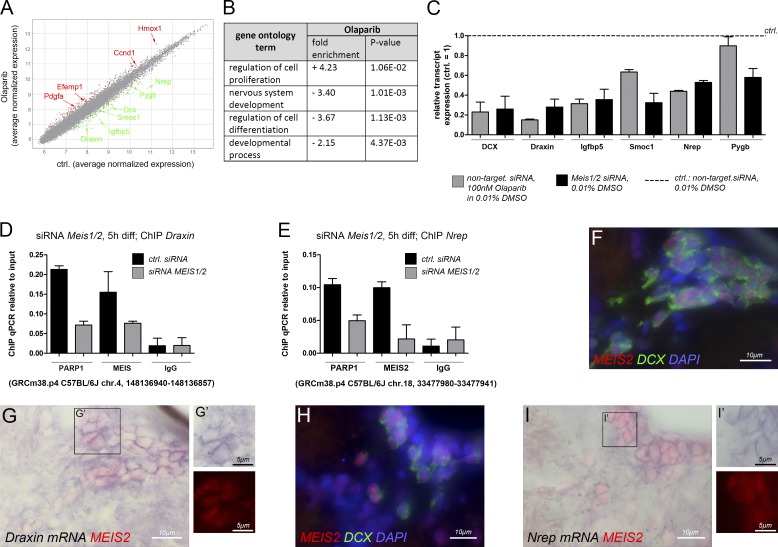
Identification of PARP-regulated genes by Affymetrix Mouse Gene 1.0 ST arrays. (A) Scatter blot of differentially regulated genes in adult SVZ progenitor cells differentiated in the presence or absence of 100 nM Olaparib; representative significantly up-regulated genes are highlighted in red, and representative significantly down-regulated genes are in green. A list of all significantly differentially expressed genes is given in Table S5. (B) GO term enrichment analysis for genes differentially expressed after Olaparib treatment relative to the control. A more detailed collection of GO terms is shown in Table S1. (C) Transcript expression of six down-regulated candidate genes in SVZ-derived stem and progenitor cells differentiated for 10 h in vitro upon pharmacological inhibition of PARP1 and PARP2 or Meis1/2 knockdown, respectively, validated by qPCR. Gray bars, PARP-inhibition: transfection with nontargeting siRNAs and treatment with 100 nM Olaparib; black bars, Meis knockdown: transfection with Meis1/2-specific siRNAs and treatment with 0.01% DMSO. Transcript levels are expressed relative to those determined under control conditions (transfection with nontargeting siRNAs and differentiation in the presence of 0.01% DMSO). (D) ChIP-qPCR for MEIS2 and PARP1 at a consensus-binding motif for MEIS/PBX-type HD proteins upstream of the Draxin transcriptional start site in adult SVZ progenitor cells after 5 h of neuronally directed differentiation. Gray bars, cells transfected with Meis1/2-specific siRNAs; black bars, cells transfected with nontargeting control siRNAs. (E) ChIP-qPCR for MEIS2 and PARP1 under identical conditions as shown in D but binding to a consensus motif for MEIS/PBX-type HD proteins upstream of the Nrep transcriptional start site was assessed. (F–I) Transcript expression for Draxin (F and G) and Nrep (H and I) in the adult SVZ visualized by in situ hybridization in comparison with MEIS2 and DCX protein expression. (F and H) MEIS2 (red) and DCX (green) cell nuclei are counterstained with DAPI (blue). (G and H) Overlay of transcript expression (purple) and MEIS2 protein (red). The number of biological replicates is listed in Table S4.

