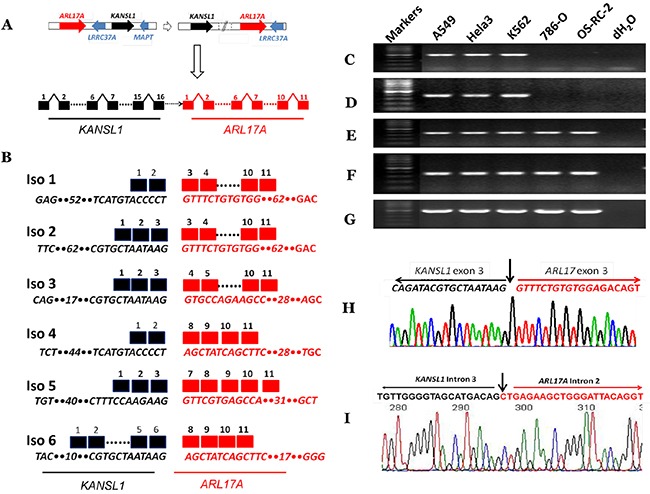
Figure 1. Identification and characterization of KANSARL (KANSL1-ARL17A) fusion transcripts.

(A) A schematic diagram showing steps of genetic rearrangements from normal genomic structures of ARL17A → KANSL1 genes to inverted genomic structures of KANSL1 → ARL17A genes on the chromosomal band 17q21.31. Dashed white horizontal arrow and solid white vertical arrow represent genomic rearrangements and potential fusion gene structures. Solid red and black horizontal arrows indicate ARL17A and KANSL1 genes, respectively. Solid blue arrows represent LRRC37A and MAPT genes, respectively. The dashed horizontal black arrow indicates undetermined genomic regions. Black and black squares represent KANSL1 and ARL17A exons respectively. (B) The schematic diagram shows KANSARL fusion transcripts identified so far. Black and red squares represent KANSL1 and ARL17A exons respectively. Dashed lines indicate omitted regions. The numbers above the black and red squares are exon numbers. The numbers within sequences indicate omitted numbers of nucleotides; (C) Validation of KANSARL isoform 1 in A549, HeLa, K562, 786-O and OS-RC-2 cell lines; (D) Validation of KANSARL isoform 2 in A549, HeLa, K562, 786-O and OS-RC-2 cell lines; (E) Detection of KANSL1 gene expression in A549, HeLa, K562, 786-O and OS-RC-2 cell lines; (F) Detection of ARL17A gene expression in A549, HeLa, K562, 786-O and OS-RC-2 cell lines; (G) Detection of GAPDH gene expression as loading controls in A549, HeLa, K562, 786-O and OS-RC-2; (H) Sanger sequencing validation of KANSARL isoform 2. The black and red letters represent KANSL1 exon 3 and ARL17A exon 3 sequences, respectively. And (I) Sanger sequencing validation of KANSARL genomic breakpoint in the Hela-3 cell line. The black and red letters indicate KANSL1 and ARL17A intronic sequences, respectively. Vertical arrows indicate the fusion junctions. The black and red lines indicate KANSL1 and ARL17A sequences, respectively. All markers are 100 bp DNA markers.
