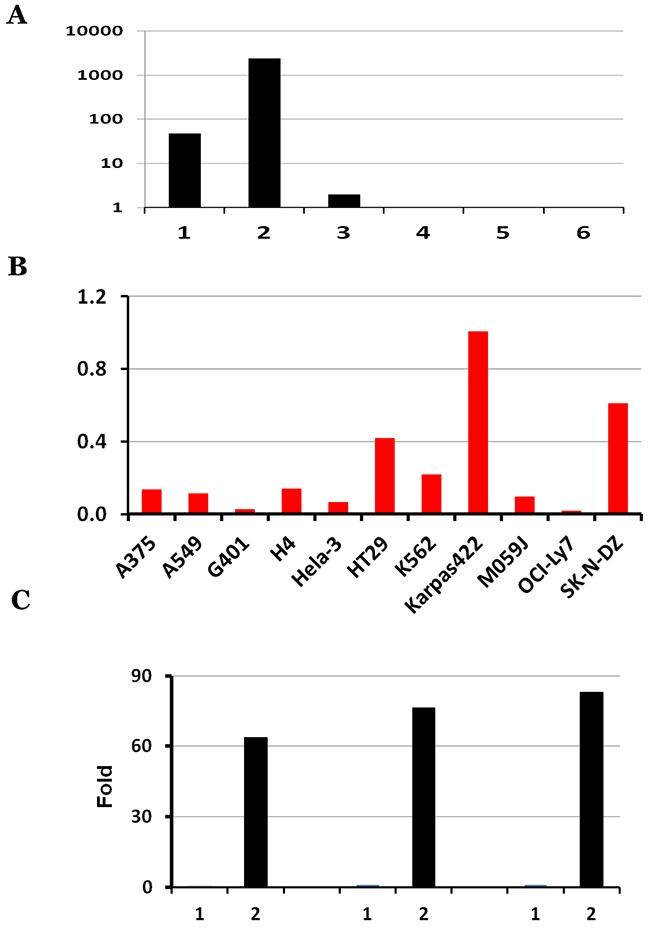
Figure 3. Characterization of KANSARL isoform expression in ECD39 cell lines, A549, HeLa and K562.

(A) Distribution of raw counts of the six KANSARL isoforms identified in the ECD39 datasets; (B) Normalization of raw counts into NSJMR (Numbers of Splice Junctions per Million) of KANSARL fusion transcripts among the KANSARL-positive cancer cell lines. Y-axis shows Numbers of Splice Junctions per Million Reads (NSJMR). (C) Quantification of KANSARL isoform 1 and 2 of A549, HeLa and K562 by real-time PCR with the primers shown in Supplementary Table 4. The raw real-time RT-PCR data of KANSARL isoform 1 and 2 of A549, HeLa and K562 are listed in Supplementary Table 3.
