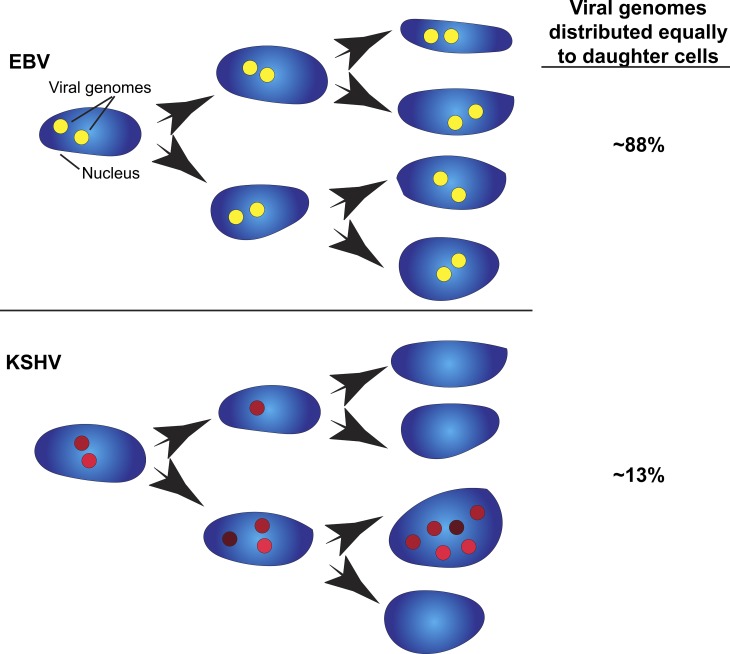
Figure 1.
Clustering and unequal distribution of KSHV genomes. Nuclei from human cells are depicted with locations of viral episomes represented as filled circles (yellow and red for EBV and KSHV, respectively). The varied red intensities depict the different amounts of KSHV episome copies per foci. The intensity of EBV episome foci and the number of foci varied less in EBV-infected cells compared with KSHV-infected cells. EBV infection tends to equally distribute episomes to promote a higher number of infected cells. KSHV infection displays unequal distribution that promotes a higher number of episomes in a subset of nuclei.

