
Figure 5. ROC and Kaplan–Meier curves for the five lncRNAs signature in TCGA LUSC cohort.
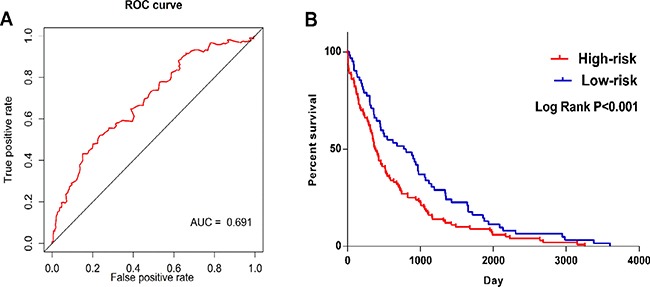
(A) Time-dependent ROC curves analysis for survival prediction by the five-lncRNA signature. (B) Kaplan-Meier survival curves showing overall survival outcomes according to relative high-risk and low-risk patients.