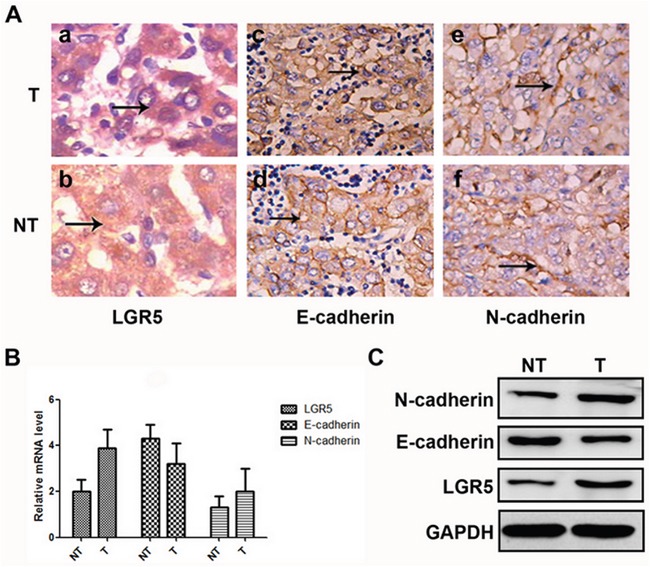
Figure 1. Expressions of LGR5, E-cadherin, and N-cadhe in HCC samples.

A. Hematoxylin and eosin staining through morphologic changes. These cells express high levels of LGR5 (a and b) and N-cadherin (e and f), but low levels of E-cadherin (c and d). B. Relative mRNA expressions of LGR5, E-cadherin and N-cadherin in tumor and adjacent non-tumor tissues, respectively. C. Western blot analysis of LGR5, E-cadherin and N-cadherin in tumor and adjacent non-tumor tissues, respectively.
