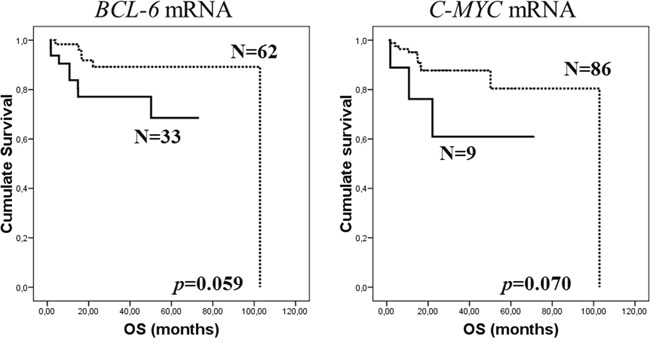
Figure 2.

Kaplan-Meier OS curves in relation to presence of BCL-6 (A) and C-MYC (B) mRNA in exosomes of pretreatment plasma samples of total series. Continuous curves show cases with mRNA absence and discontinuous curves show cases with mRNA presence.
