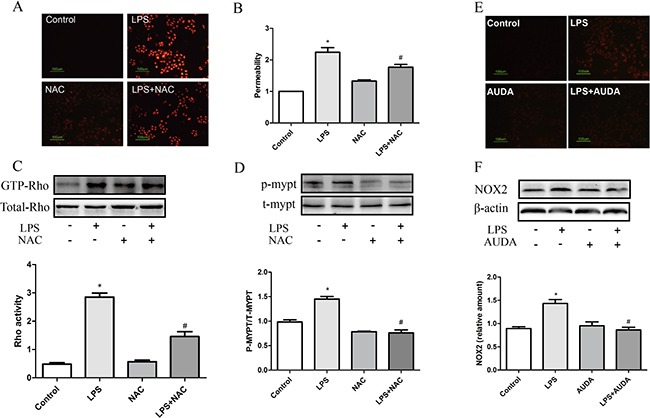
Figure 5. ROS generation was involved in LPS-induced hyperpermeability.

(A) NAC eliminated LPS induced ROS production; (B) NAC suppressed LPS induced permeability increase; (C and D) LPS induced Rho activation and subsequent MYPT phosphorylation was attenuated by NAC. (E, F) LPS induced ROS production and NOX2 expression was attenuated by NAC. Each tests was repeated for at least three times. Data are expressed as means ± SEM. *P < 0.05 versus Control; #P < 0.05 versus LPS.
