
Figure 4. Assessment of MYC, p-AKT, and AR expressions in organoids.
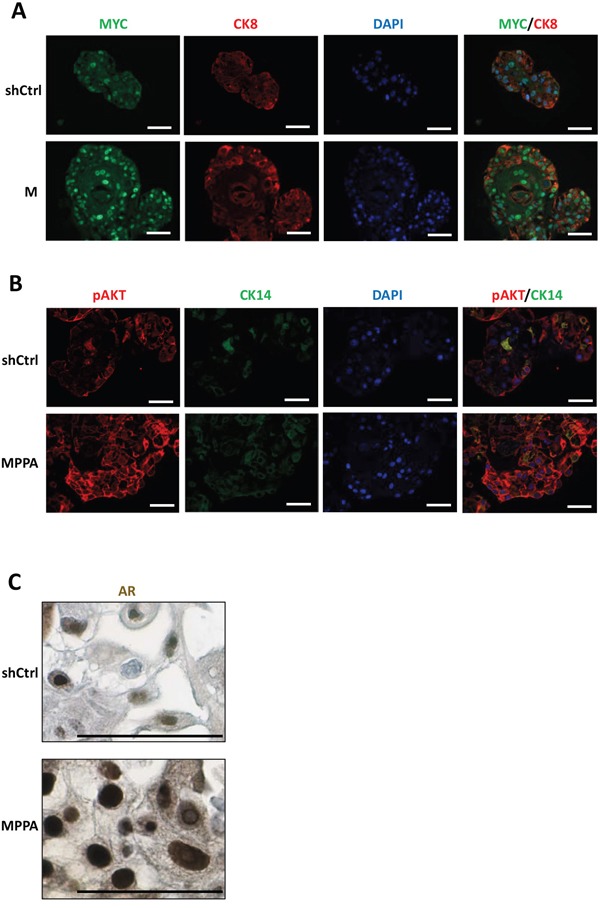
(A to C) Representative images of MYC, AR, and p-AKT expressions. Organoids with immunofluorescence staining for MYC (green) and CK8 (red) at day 8 (A), pAKT (red) and CK14 (green) at day 21 (B), and IHC staining for AR at day 21 (C). Blue, DAPI. Scale bars 50 um.