
Figure 6. Assessment of malignant transformation of organoids in vitro.
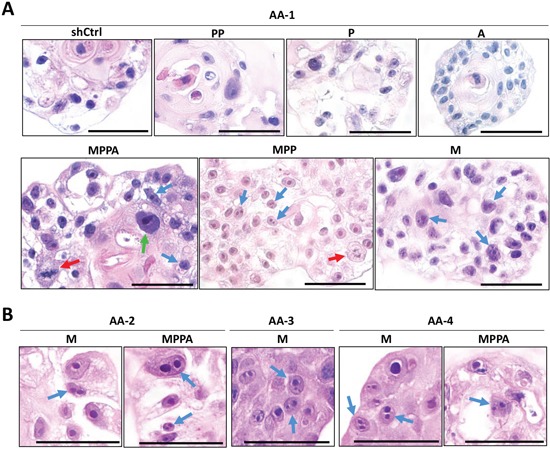
Representative images of MPPA, MPP, PP, P, M, A, and shCtrl organoids derived from AA-1 sample with H&E staining at day 8 (red arrows, mitotic cells; blue arrows, multiple prominent nucleoli; green arrow, enlarged nuclei and prominent nucleoli) (A). Representative images of multiple prominent nucleoli of MPPA and M organoids derived from AA-2, AA-3, and AA-4 tissues with H&E staining at day 8 (blue arrows, multiple prominent nucleoli) (B). Scale bars 50 um.