
Figure 7. Immunohistochemical staining for prostate-specific antigen (PSA) and α-methylacyl-CoA racemase (AMACR) in organoids.
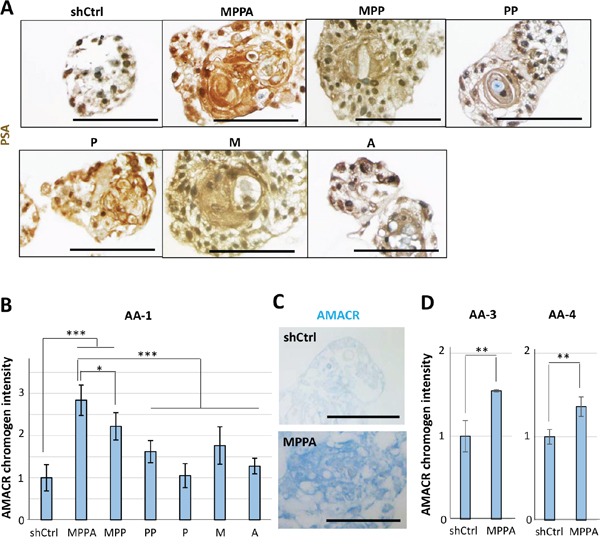
(A) Representative images of MPPA, MPP, PP, P, M, A, and shCtrl organoids derived from AA-1 tissue with IHC staining for PSA at day 8. (B) Relative AMACR chromogen intensity of MPPA, MPP, PP, P, M, A, and shCtrl organoids derived from AA-1 at day 21. Chromogen intensity was measured by Fiji software (ImageJ) (http://fiji.sc/Fiji). (C) Representative images of MPPA and shCtrl organoids with IHC staining for AMACR at day 21. (D) Relative AMACR chromogen intensity of MPPA and shCtrl organoids derived from AA-3 and AA-4 at day 8. Scale bars 100 um. *p < 0.05, **p < 0.01, ***p < 0.001.