
Figure 8. Drug treatment response in organoids.
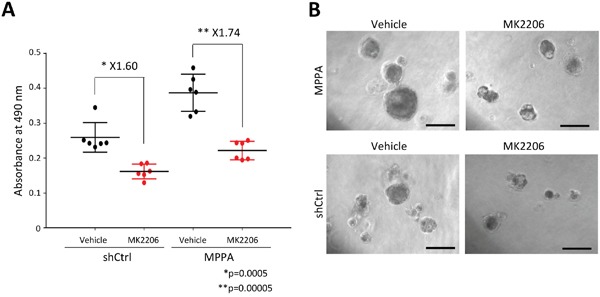
(A) The response to allosteric AKT inhibitor, MK-2206, of MPPA and shCtrl derived from AA-1 tissue was assessed by MTS-based cell proliferation assay. (B) Representative images of MPPA and shCtrl organoids at days 6 after 3 uM MK-2206 and DMSO (vehicle) treatment. Scale bars 100 um.