
Figure 4. Ox-LDL induced macrophage foam cell formation, SIRT1 inhibition, autophagy impairment, and MCP-1 production in THP-1 cells.
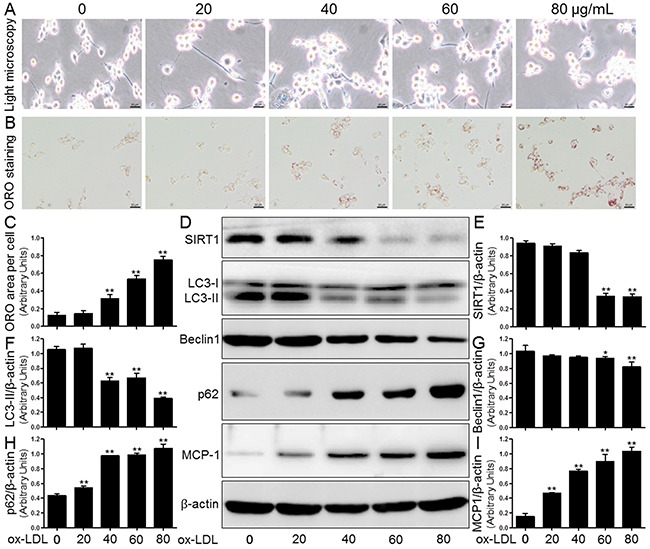
Human THP-1 macrophages were exposed to 0, 20, 40, 60, and 80 μg/mL of ox-LDL for 24 hrs. Treated cells were photographed using light microscopy (A). The THP-1 macrophage-derived foam cell formation was determined using ORO staining method (B) and (C). Western blot for SIRT1, LC3, Beclin1, p62, and MCP-1 proteins were analyzed from the ox-LDL-stimulated THP-1 cells. β-actin was used as loading control (D-I). Scale bar: 20 μm. Bar graph indicates the mean ± SD (n = 3). *P < 0.05 and **P < 0.01 vs. Cont group (0 μg/mL of ox-LDL).