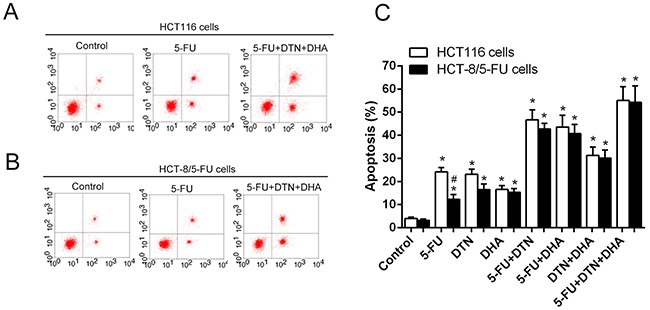
Figure 2. Characteristics of apoptosis in HCT 116 cells and HCT-8/5-FU cells following different treatment of 5-FU, DTN or DHA.

(A) and (B) After different treatment for 48h, Flow cytometry analysis of apoptosis in HCT116 cells (A) and HCT-8/5-FU cells (B) (part of the FACS data). (C) Dynamic trend of apoptosis in HCT116 or HCT-8/5-FU cells following different treatment of 5-FU, DTN or DHA. *P <0.05 showed a significant difference compared to control. # P <0.05 showed a significant difference between HCT116 cells and HCT-8/5-FU cells.
