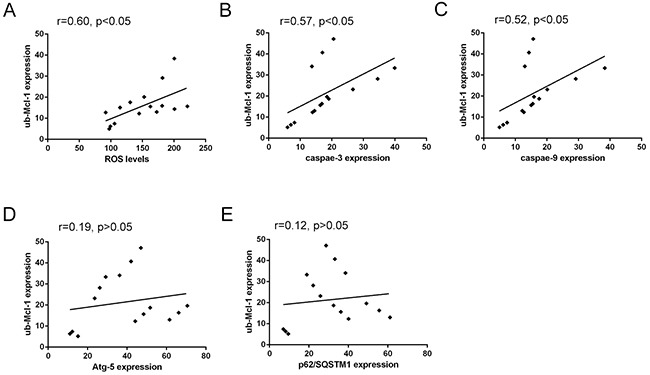
Figure 7. Correlated trend between Mcl-1 polyubiquitination and ROS levels, Atg-5, p62/SQSTM1, Caspase-3 or Caspase-9 expression.

(A) Scatter diagram between Mcl-1 polyubiquitination and ROS levels. (B) and (C) Scatter diagram between Mcl-1 polyubiquitination and apoptosis-related proteins Caspase-3 and Caspase-9 expression. (D) and (E) Scatter diagram between Mcl-1 polyubiquitination and autophagy-related proteins Atg-5 and p62/SQSTM1 expression.
