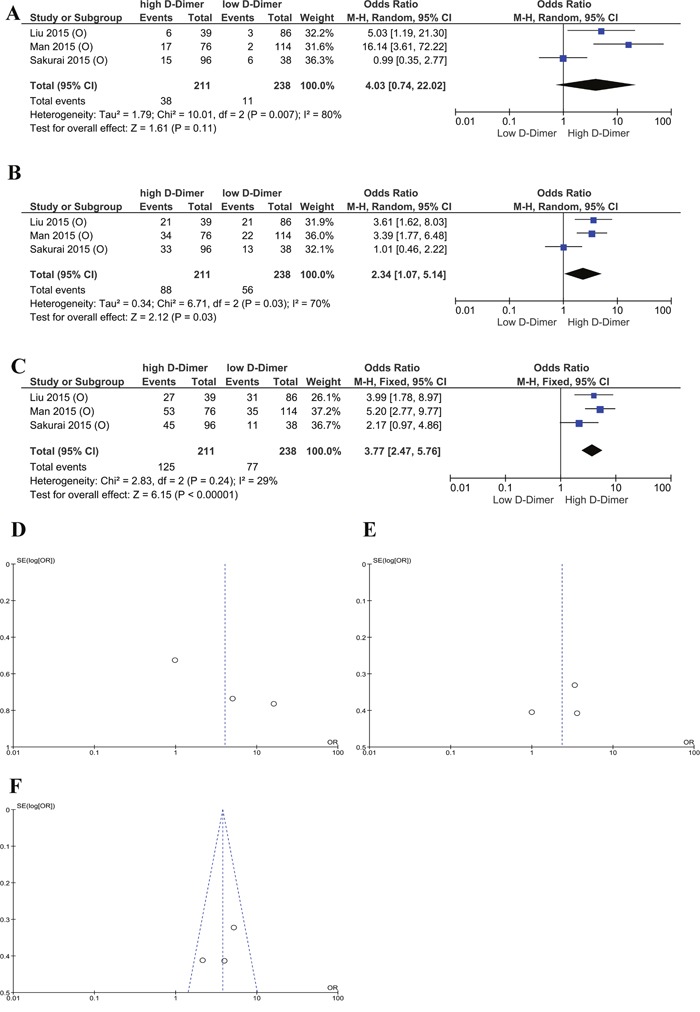
Figure 5. Subgroup analysis of ovarian cancer.

(A) Forest plot of 1 year OS rates of high and low plasma D-dimer. (B) Forest plot of 3-year OS rates of high and low plasma D-dimer. (C) Forest plot of 5-year OS rates of high and low plasma D-dimer. (D) Begg's funnel plots of publication bias of 1-year OS rates of high and low plasma D-dimer. (E) Begg's funnel plots of publication bias of 3-year OS rates of high and low plasma D-dimer. (F) Begg's funnel plots of publication bias of 5-year OS rates of high and low plasma D-dimer.
