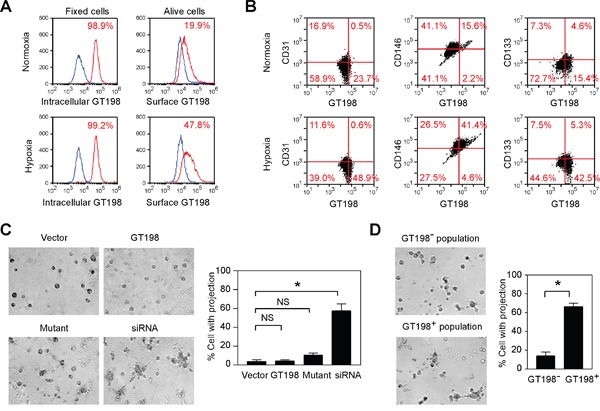
Figure 9. Hypoxia induces cell surface expression of GT198 and GT198 activation promotes tube formation in U-251 cells.

(A) Hypoxia-induced U-251 cells were FACS analyzed using either methanol fix for intracellular GT198, or living cells for surface GT198. (B) Flow cytometry quadrant dot plots with GT198 on the x-axis and CD31, CD146, and CD133 as indicated on the y-axis. The numbers at each corner indicate the percentage of U251 cells. (C) U-251 cells were transfected with wild type GT198 (1-217), mutant GT198 (126-217), siRNA (100 nM), or vector as a control. Tube formation on Matrigel cultured in serum-free medium overnight was photographed, and the percentage of cells with projections was quantified (n=2). (D) GT198+ and GT198- cell populations isolated from siRNA-transfected U-251 cells were compared in Matrigel tube formation assays with quantification. P values were calculated by unpaired two-tailed t test. * P<0.05.
