
Figure 3. PFS and OS of the 53 patients according to the MB4 breakpoints and del(17p) /amp(1q21).
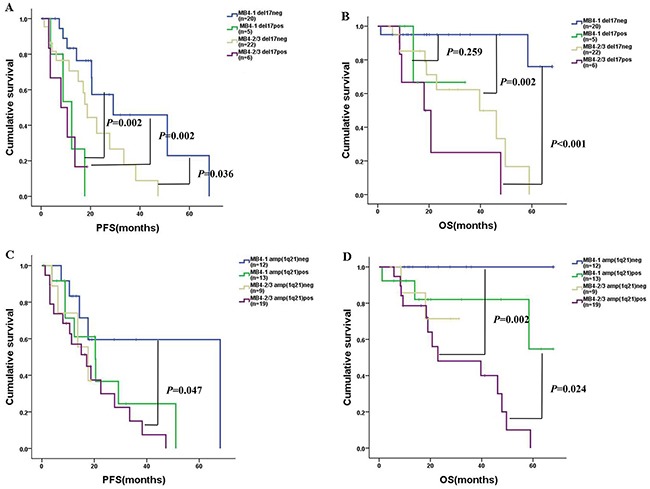
(A)-(B): MB4-1 without del(17p) (n=20): blue curve; MB4-1 with del(17p) (n=5): green curve; MB4-2/MB4-3 without del(17p) (n=22): brown curve; MB4-2/MB4-3 with del(17p) (n=6): purple curve. The MB4-1 without del(17p) subgroup had longer PFS than the other three subgroups (P=0.002, 0.036 and 0.002, respectively). MB4-1 without del(17p) subgroup had longer OS than MB4-2/MB4-3 with/without del(17p) (P<0.001 and P=0.002), however, the MB4-1 without del(17p) subgroup had similar OS compared to the MB4-1 with del(17p) subgroup (P=0.259). (C)-(D): MB4-1 without amp(1q21) (n=12): blue curve; MB4-1 with amp(1q21) (n=13): green curve; MB4-2/MB4-3 without amp(1q21) (n=9): brown curve; MB4-2/MB4-3 with amp(1q21) (n=19): purple curve. The MB4-2/MB4-3 with amp(1q21) subgroup had shorter PFS than MB4-1 without amp(1q21) (P=0.047), but similar PFS compared to the other two subgroups (P=0.281 and 0.84). The MB4-2/MB4-3 with amp(1q21) subgroup had shorter OS than MB4-1 with or without amp(1q21) (P=0.024 and 0.002), but similar OS compared to the MB4-2/MB4-3 without amp(1q21) subgroup (P=0.61).