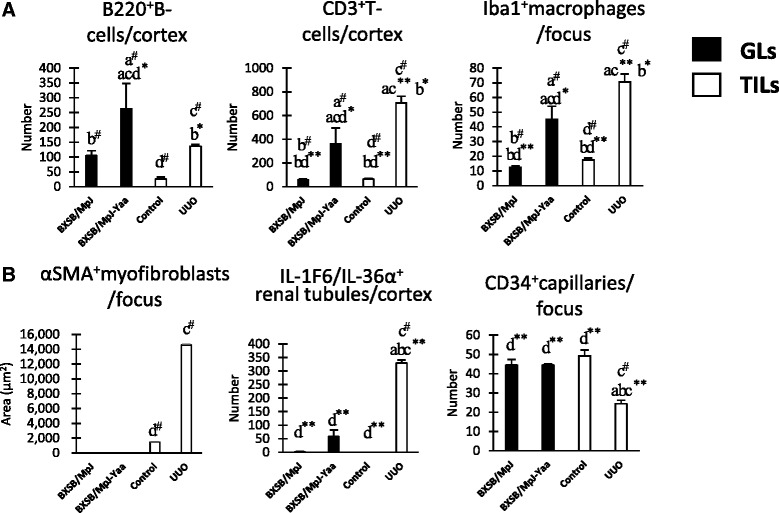
Fig. 3.

Tubulointerstitial lesion (TIL)-associated histological parameters in both glomerular lesions (GL) and TIL models. a Indices for the number of infiltrating B220+ B-cells, CD3+ T-cells, and Iba1+ macrophages in the model mice. b Indices for tubulointerstitial damage, including the area of αSMA+ myofibroblasts and the number of IL-1F6/IL-36α+ damaged tubules and CD34+ capillaries in the model mice. Values = mean ± SE. #: Significant difference from the control in the same disease group, Mann–Whitney U test (p < 0.05). * Significant difference from the other groups, Kruskal-Wallis test followed by Scheffe’s method (* p < 0.05, ** p < 0.01). N = 4. a, b, c, and d denote BXSB/MpJ, BXSB/MpJ-Yaa, Control, and UUO kidney, respectively
