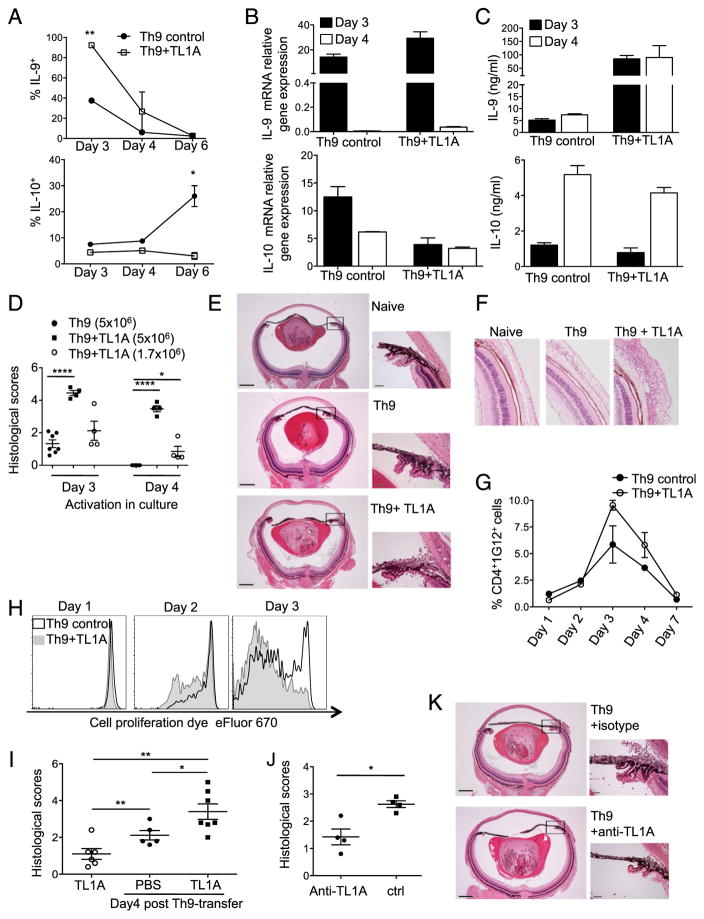
FIGURE 6.
TL1A enhances ocular inflammation induced by Th9. (A) Naive anti-HEL CD4+ TCR transgenic T cells were activated with HEL+APC under Th9 conditions, with or without TL1A. Cells were analyzed for intracellular IL-9 and IL-10 production at the indicated time points (Student t test: *p < 0.05, **p < 0.01); combined results from three independent experiments. (B) IL-9 and IL-10 mRNA were measured relative to β-actin in cultures described in (A); combined results from two independent experiments. (C) Cytokine production was measured in the supernatants of cultures described in (A); combined results from three independent experiments. (D) Th9 cells generated as in (A) (5 million or 1.7 million to compensate for increased percentage of cells expressing IL-9 in the presence of TL1A) were adoptively transferred into syngeneic recipients expressing HEL in the lens. Inflammatory changes in recipients of Th9 cells activated for 3 or 4 d in culture were evaluated by histological analysis 7 d after transfer (Mann–Whitney U test, *p < 0.05, ****p < 0.0005); combined results from three independent experiments. (E) H&E-stained eye sections are examples of mice described in (D) receiving 5 million Th9 cells, differentiated for 3 d, and a mouse with no treatment (naive). Scale bars, 400 μM (left) and 50 μM (right), enlarged from the indicated boxes; representative of three independent experiments. (F) Histological sections showing conjunctivitis in recipients of Th9 and TL1A-stimulated Th9 cells are representative of three independent experiments (original magnification ×63). (G) As in (D), 5 million transgenic T cells were transferred into recipients after 3 d of differentiation. Recipient spleens were collected at the indicated time points and donor cells identified by flow cytometry with an anti-clonotypic mAb (1G12), specific to the donor cell TCR. Graph shows mean ± SEM of transgenic T cell yields from two independent experiments. (H) Th9 cells transferred as in (D) were labeled with Cell Proliferation Dye eFluor 670 and their division in vivo determined by dye dilution at the indicated times after transfer: black line, Th9 control; gray line and shaded graph, Th9+TL1A; representative of two independent experiments. (I) Naive mice or recipients of Th9 transfer as in (D) were injected with PBS or TL1A intraocularly 2 and 3 d after transfer. Eye pathology was examined at day 4 (Mann–Whitney U test, *p < 0.05, **p < 0.01); combined results from at least two independent experiments per condition. (J) Recipients of Th9 transfer as in (D) were administered anti-TL1A Ab or hamster Ig control on days −1 and 3. Recipient eyes were analyzed on day 7 (Mann–Whitney U test, *p < 0.05); combined results from three independent experiments. (K) Representative examples of ocular histological sections from transfer experiments in (J). Scale bars as in (E).

