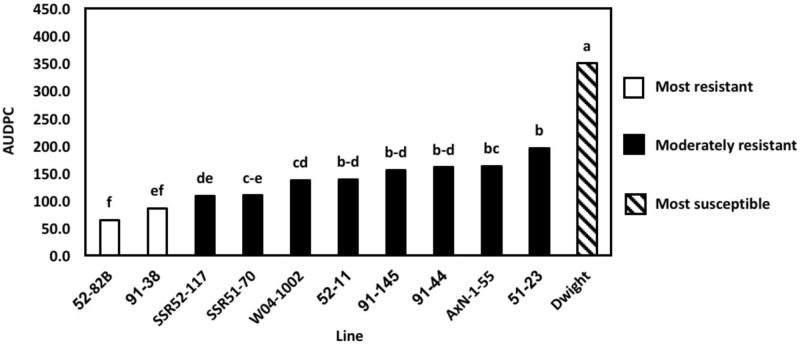
FIGURE 3.
Area under the disease progress curve (AUDPC) of multi-isolate greenhouse evaluations. Means followed by the same letter are not significantly different based on Fisher’s Least Significant Difference (LSD; α = 0.05). LSD values were calculated based on the lognormal transformed AUDPC values.

