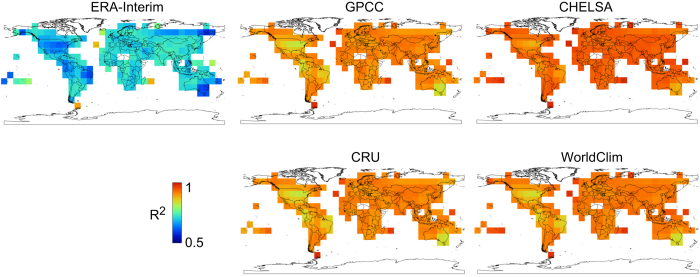
Figure 2. Small scale comparison of model fit with station data from GHCN14,15 for annual precipitation sums derived from six different models.
Models have been calculated for each station separately, including a minimum of 16 surrounding stations in a 2° search radius. This illustrates how well modelled precipitation corresponds to measured stations at the scale <=2°. The figure shows the mean R2 value for 2° grid cells. The upper row additionally illustrates different steps of the CHELSA algorithm, with ERA-Interim17 performing worse than GPCC50, and CHELSA showing the highest fit after including orographic effects.

