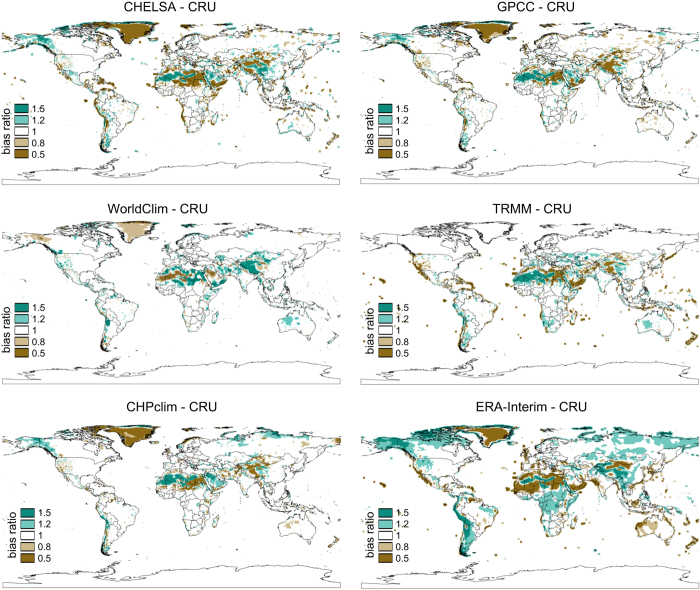
Figure 4. Bias ratio comparison of annual precipitation sums for six different climatologies with the CRU9 climatology at the global scale.
All models have a substantial dry bias over Greenland when compared to CRU (TRMM/TMPA (3B43)53 does not include Greenland). Large differences in bias ratios can be observed in the Atacama, where CHELSA, and GPCC50 are drier than CRU, and WorldClim8, CHPclim52, TRMM/TMPA (3B43), and ERA-Interim17 are wetter. Also on the Himalaya plateau large differences are visible, with CHELSA, GPCC, and TRMM (3B43) being drier, and WorldClim and ERA-Interim being wetter.

