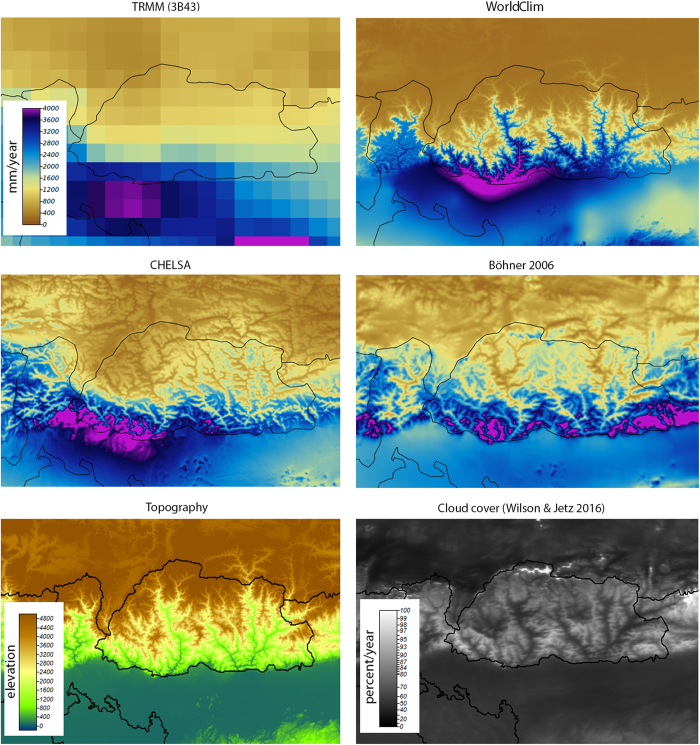
Figure 5. Comparison of precipitation patterns in the complex terrain of Bhutan (country boundaries in black) between TRMM/TMPA (3B43)53, WorldClim8, CHELSA, the statistical downscaling approach of Böhner31, the topography from GMTED201029, and the cloud cover climatology from Wilson & Jetz54.
In this region, most precipitation falls during the SW-monsoon in the northern summer, when wet air masses from the SW are lifted at the south face of the Himalayas and dry until reaching the Tibetan high plateau. While the mesoscale patterns are in congruence between models, there are clear differences at the microscale. WorldClim8 predicts wet valleys and dry mountain faces, whereas CHELSA and Böhner31 predict dry valleys and wet windward exposed mountain faces due to the inclusion of orographic predictors. CHELSA and Böhner31 are also in closer congruence with the observed distribution of cloud in the area, which shows lower cloud cover in the isolated mountain valleys compared to the wind exposed mountain faces in the south.

