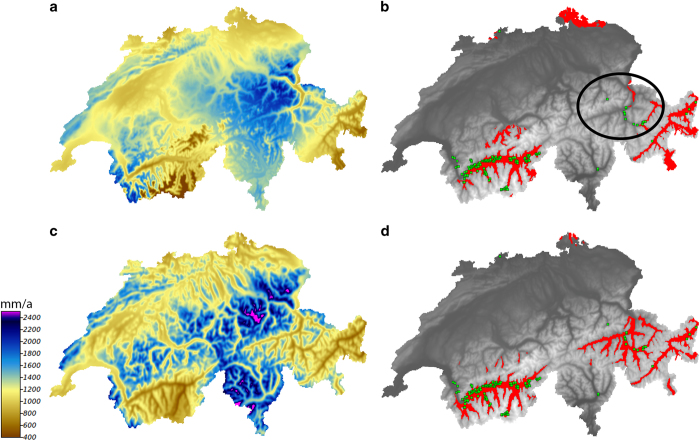
Figure 8. Comparison of species distribution models based and climate data from WorldClim8 and CHELSA of Astragalus monspessulanus for Switzerland.
Models were calculated using generalized linear models with mean annual precipitation from WorldClim (a) and CHELSA (c), as well as the mean annual temperature. The distributions based on WorldClim (b) and CHELSA (d) represent a binary distribution (red) with a threshold of the maximum kappa (WorldClim: threshold=0.675, AUC=0.89, D2=0.36, Kappa=0.60, TSS=0.66, CHELSA: threshold=0.7155, AUC=0.91, D2=0.47, Kappa=0.66, TSS=0.76). Occurrences are marked in green. The circle indicates the area of the dry Rhine valley in eastern Switzerland in which WorldClim overestimates precipitation and therefore does not predict the range of the species correctly in that region (compare with d).

