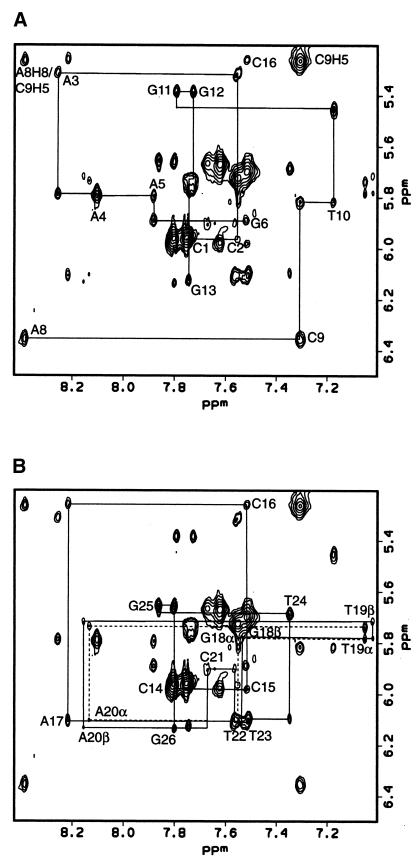
Figure 2.
NOE walks from H1′ to base protons for a 200 ms NOESY experiment at 750 MHz. (A) C1–G6 and A8–G13 are shown. (B) C14–G26 is shown. Where the α anomer differs from the β anomer (G18–C21), its NOE walk is shown as a dashed line. Connectivity cannot be seen between A20 and C21 for this region, but it is clearly seen in the H2′/H2″–base and H3′–base regions.

