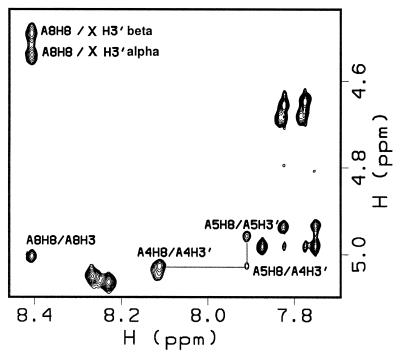
Figure 4.
H3′ to base proton region for 1, where X indicates the position of the abasic site, in a 200 ms NOESY experiment at 750 MHz. Strong NOEs are observed between the H3′ of the abasic site and its neighboring A8 H8. In B form DNA these NOEs are expected to be much weaker, as illustrated by the NOE between A5 H8 and A4 H3′.

