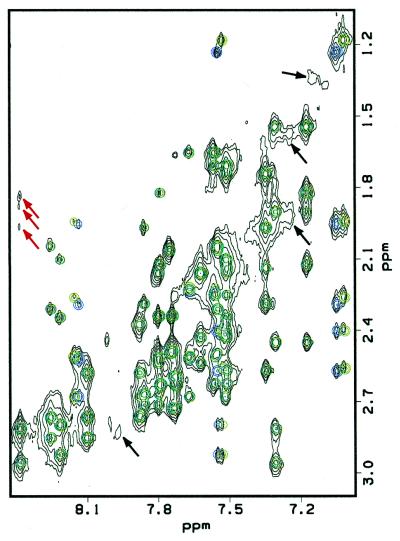
Figure 7.
Back-calculation of a 200 ms NOESY spectrum (750 MHz). The experimental data is shown in black, the back-calculated spectrum of the α anomer is overlaid in blue and the back-calculated spectrum of the β anomer is overlaid in green. Back-calculations were performed on an average of 10 structures for both anomers. Black arrows indicate examples of NOEs belonging to a minor conformation in the experimental data which could not be assigned due to its low abundance in solution (∼5%). The weak NOEs of the abasic site (indicated by red arrows) can be seen in the back-calculated spectrum at a lower contour level.

