Significance
Animals have evolved mechanisms for gathering information from the environment to make apt decisions. An important example is the regulation of feeding, where animals weigh nutritional value with the associated energetic costs. Many species feed in short bursts interspersed with pauses, yet the function and advantages of this strategy are unknown. We suggest that these bursts are used both to collect food and to gather information. Using quantifiable feeding behavior from Caenorhabditis elegans, we define a model that formalizes this decision process. The model shows that burst feeding is advantageous when information about the expected food is noisy. This conceptualization of feeding behavior suggests optimal feeding strategies in response to conflicting inputs and to fluctuating environments.
Keywords: decision theory, feeding behavior, sequential analysis
Abstract
Animals regulate their food intake in response to the available level of food. Recent observations of feeding dynamics in small animals showed feeding patterns of bursts and pauses, but their function is unknown. Here, we present a data-driven decision-theoretical model of feeding in Caenorhabditis elegans. Our central assumption is that food intake serves a dual purpose: to gather information about the external food level and to ingest food when the conditions are good. The model recapitulates experimentally observed feeding patterns. It naturally implements trade-offs between speed versus accuracy and exploration versus exploitation in responding to a dynamic environment. We find that the model predicts three distinct regimes in responding to a dynamical environment, with a transition region where animals respond stochastically to periodic signals. This stochastic response accounts for previously unexplained experimental data.
Regulation of food intake is important for maintaining energy balance in animals. Failure can lead, for example, to reduced fitness, metabolic disorders, and cardiovascular diseases (1, 2). To successfully regulate their feeding, animals need to assess the expected availability of food in their environment.
Recent advances in automated longitudinal imaging of small animals make the acquisition of large-scale quantitative feeding data possible. Data from worms (3, 4) and flies (5) reveal complex dynamics that are responsive to the availability of food in the animal’s environment. These data suggest that food uptake occurs in bouts of high-rate feeding, whose duration and frequency increase with the presence of food. Whether these dynamics serve a function is not known.
In this paper we hypothesize that the dynamics of feeding observed in small animals are intimately related to a decision-making process. Since feeding behaviors are costly in energy and can expose animals to toxins and pathogens, the decision to feed carries consequences and should be considered carefully by the animal. We posit that food uptake from the environment serves two purposes: to provide the animal with information about the food that is available in the environment and to take up nutrients. To explore the implications of this assertion, we develop, analyze, and experimentally test a quantitative model.
We focus on the regulation of feeding by the roundworm Caenorhabditis elegans, a free-living nematode that is found predominantly in fruit composts and feeds on bacteria. The feeding organ of the worm, the pharynx, is a simple neuromuscular pump. Each pump brings a small number of bacteria suspended in water into the pharyngeal lumen. The pharynx then expels the water, grinds the bacteria, and sends them into the intestine. Pumping is therefore a proxy for the behavioral dynamics of feeding. Supported by microfluidics technology, time traces of pumping in individual worms can be obtained over long periods of time using either optical (3, 4) or electrophysiological (6) methods.
Decision making is a process for committing to an action, based on an estimate of the current (and perhaps future) conditions. A hallmark of decision making is integration of evidence to estimate the likelihood of each condition and to gauge the cost and benefit of possible choices. In feeding, this evidence takes the form of ingesting small samples from the environment. The concentration and composition of each sample provides the animal with information to update its estimate of the availability and quality of food in the environment.
We formulate and analyze a model of feeding dynamics within the framework of sequential decision theory (also known as sequential analysis). The success of this theoretical framework in conceptualizing the process of evidence integration has been demonstrated in cells, insects, rodents, primates, and humans (7–14). Within this model, we find that worms balance several trade-offs, including speed vs. accuracy and exploration vs. exploitation. We highlight predictions of these models and reinterpret existing data in this new light. Finally, we discuss in detail commonalities between the feeding decision process and neuronal mechanisms of decision making.
Results
C. elegans Feeding Is a Bursty Stochastic Process.
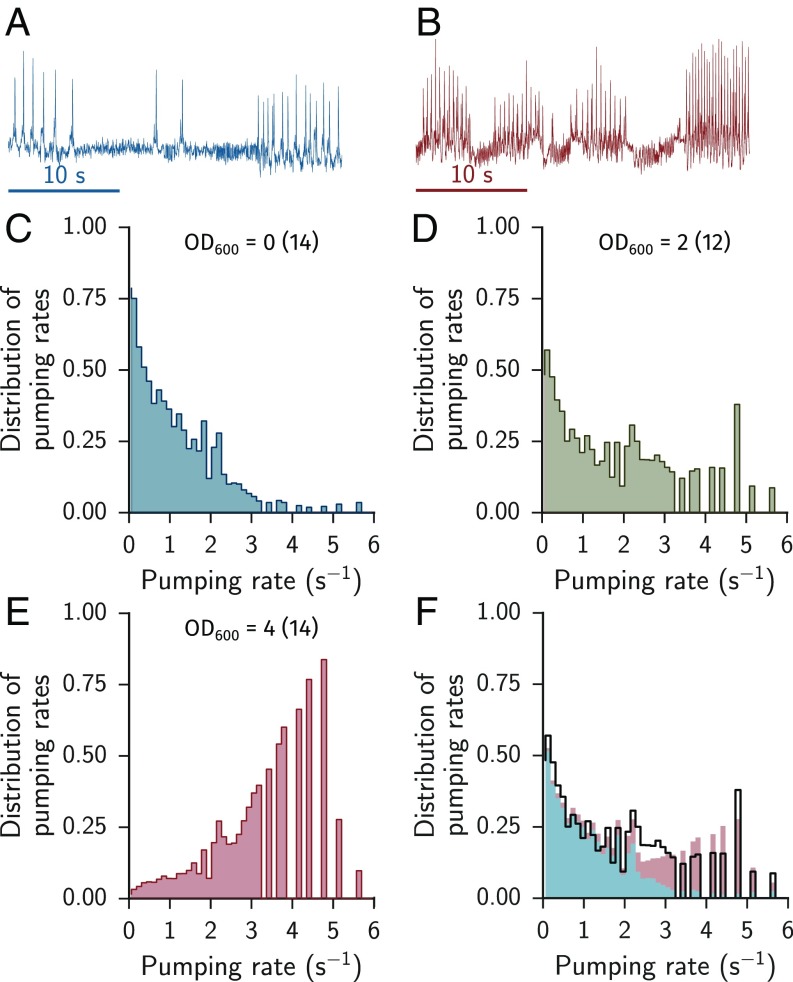
To measure feeding dynamics we confined worms to small chambers of a microfluidic device and provided them with bacteria at a fixed density. We tested ambient bacteria densities in the range of bacteria/mL (OD600 = 0.05 − 5), corresponding to bacteria per volume of the pharyngeal lumen (15, 16). For each ambient density we collected feeding times series from multiple worms by automatically tracking the motion of their grinder (3, 4). Exemplary trajectories show bursts of consecutive pumps and pauses (Fig. 1 A and B).
Fig. 1.
C. elegans feeding can be approximated by a two-state system. (A and B) Raw feeding trajectories at low and high food ( = 0 and 4, respectively). The sharp peaks indicate pumping events. (C–E) Distribution of instantaneous pumping rates for low, medium, and high food concentrations ( = 0, 2, and 4, respectively). (F) Weighted combination of the pumping rate distribution at low and high food (blue and red) compared with the medium food concentration (black). The weighting factor was found by minimization. The best fit is , with and . The rate distribution at intermediate food is shown in black. The panels are reproduced from data presented in ref. 4.
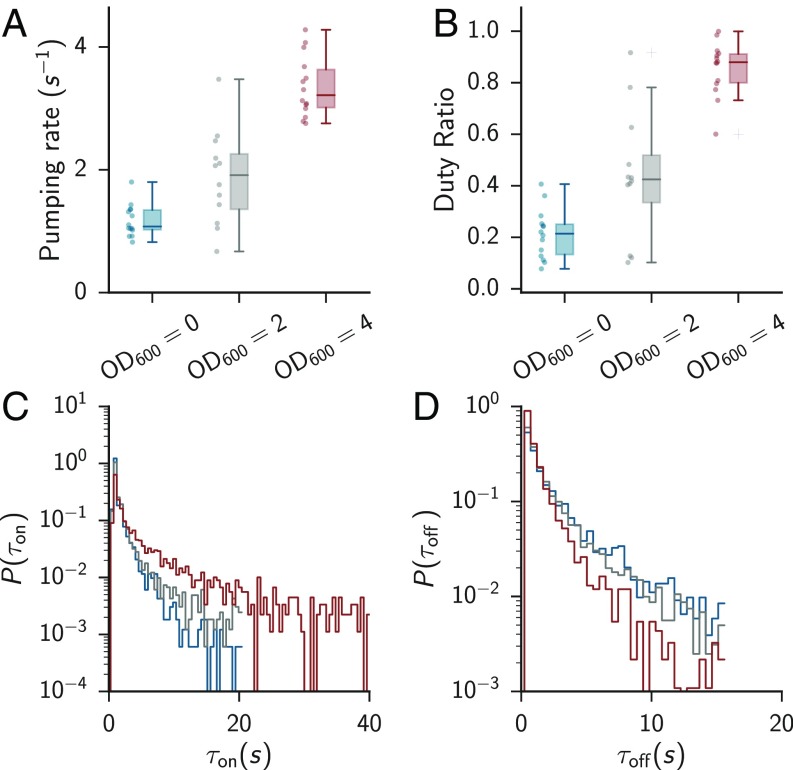
Based on these trajectories, we calculated the mean instantaneous pumping rate and the duty ratio (fraction of time spent in rapid pumping). We found that the overall pumping activity correlates with the concentration of available food and that pumping does not completely cease when no food was available (Figs. 1 and 2 A and B) (3, 17–19). In the absence of food, worms exhibit long pauses (Fig. 1C), while at high food concentrations they pump at a characteristic rate of Hz (Fig. 1E), close to the highest physiologically possible rate (20). An intermediate food concentration evokes a distribution of pumping rates that can be approximated by a linear combination of the high- and no-food distributions, Fig. 1 D and F.
Fig. 2.
C. elegans feeding is a stochastic process. (A) Pumping rate as a function of food level. Error bars denote 5th and 95th percentiles. The boxes show the upper and lower quartiles. , 12, and 14 for food levels of 0, 2, and 4, respectively. (B) Duty ratio (fraction of rapid pumping) as a function of food level. The duty ratio was defined as the fraction of time during which consecutive pumps were 500 ms apart. Error bars show th and th percentiles. (C and D) Duration of bursts and pauses for the three food levels. Bursts are defined as series of continuous pumps 500 ms apart. Colors are the same as in A and B. A and B are reproduced from data presented in ref. 4.
At all food concentrations pharyngeal pumping showed bursts of rapid feeding interspersed with pauses. We define a burst of rapid pumping as a series of continuous pumps not more than 500 ms apart. The observed rise in pumping rate with increased food concentration resulted both from a broader distribution of bursts and a narrower distribution of pauses (Fig. 2 C and D). The mean burst duration positively correlated with the mean pumping rate in individual animals (Table S1 and Fig. S1). Together, our data suggest that pharyngeal pumping can be described in terms of two states—rapid pumping and pauses—and the dynamics of switching between them.
Table S1.
Correlation between mean burst duration and average pumping rate for individual animals
| Food level in | Pearson R | P value |
| 0 | 0.74 | 0.0024 |
| 2 | 0.77 | 0.0032 |
| 4 | 0.66 | 0.0100 |
Fig. S1.
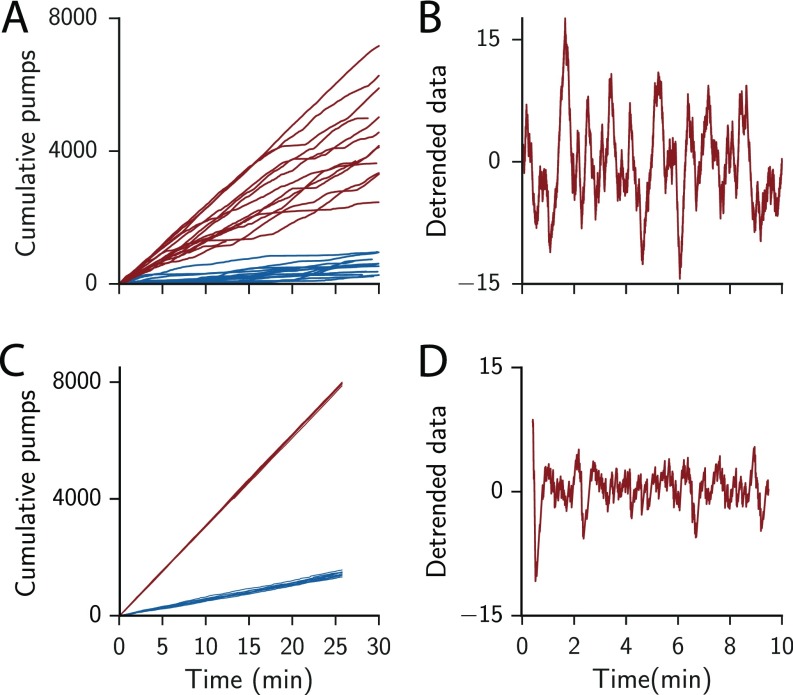
Variability of C. elegans feeding. (A) Cumulative number of pumping events over 30 min ( = 0 and 4, blue and red, respectively). Individual lines are from individual animals. (B) Example of deviations from the local mean pumping rate as calculated by subtracting a local linear trend with a width of 1 min from the data shown in A. (C) Cumulative pumping events as obtained from simulations with standard parameters at 10 and 30 bpp mean food levels, blue and red, respectively. Each condition was simulated 10 times and is shown as individual lines. (D) Example of deviations from the local mean pumping rate, similar to B, but for simulated trajectories. Each time step in the stimulation represents 1/6 s.
A Decision Theory-Based Model for Adaptive Feeding.
The bursty feeding behavior described above appears in several small animals, raising the question of whether regulation of food intake through bursts and pauses is an advantageous strategy. To investigate this question, we frame feeding behavior as a decision process: An animal has to integrate (potentially noisy) information from the environment to decide whether the benefits of feeding exceed the costs.
A model of pharyngeal pumping should reflect the stochastic switching between bursts and pauses observed experimentally. Our data suggest that the durations of bursts and pauses are not distributed exponentially (Fig. 2 C and D), excluding a two-state Markov process with concentration-dependent rates, arguably the simplest possibility. Thus, we instead formulate a three-state decision theory model where animals adjust the transition rates to environmental conditions in a memory-dependent process.
In our model, feeding dynamics cycle through three states: sampling, committed, and resetting. During the sampling state, the animal samples the environment by pumping, until it collects enough information to make a decision whether to commit to pumping or pausing. Based on this decision, it enters a committed state for a finite period. It then resets its estimate of the environment and the cycle restarts.
Sampling.
In the sampling state, the worm is gathering information about the environment. With each pump, an animal ingests a small number of bacteria from the surrounding population. At low densities, the number of bacteria per pump (bpp) is modeled as a random variable that obeys a Poisson distribution with a mean proportional to the ambient food concentration. We denote the energy required for the pharyngeal motion associated with a pump by , where is the nutritional value of a single bacterium (i.e., the energy gained from digesting it). The value of sets a threshold: A single pump only proves beneficial if the total energy gain resulting from the ingested bacteria exceeds . To decide whether to commit to pumping or to pausing, the worm needs to decide whether the ambient food concentration (measured in units of number of bacteria per volume of a single pump) is respectively higher or lower than .
We model the sampling state as a sequential decision process. In this framework, decision making starts with a prior , which summarizes the innate belief of the animal that the ambient food density is . This prior is set by evolution and refined through epigenetics, learning, and memory, all occurring on timescales much longer than the process considered here (see Discussion). The animal then samples the environment and uses the evidence it collects to update this belief, which after samples takes the form . Most important in this formulation is the decision variable (DV), which summarizes the current belief of the animal with a single number used to make the decision. Typically, if the DV is larger than some threshold the animal concludes that the condition belongs to one set, which justifies one action. If the DV is smaller than another threshold the animal concludes a different condition and takes a different action. Otherwise, if the DV takes some intermediate value the animal makes no decision and goes on to collect further evidence.
In our model, the evidence collected in each sample is the number of ingested bacteria. The probability for a sample of size follows a Poisson distribution with a parameter , the true ambient bacteria density. It is convenient to assume that the prior distribution of the ambient food concentration takes the form of a Gamma distribution, which is the conjugate before the Poisson distribution:
| [1] |
where is the Gamma function and and are the shape and scale parameters of the Gamma distribution. The time dependence of this probability can therefore be tracked through the time evolution of and .
We assume that the worm updates the probability distribution using a Bayesian rule, where serves as the prior for and the number of bacteria ingested in a single pump, , is the evidence. The decision dynamics is therefore
| [2] |
Thus, after each pump the posterior remains a Gamma distribution, with new shape and scale parameters
| [3] |
From we can define the DV as
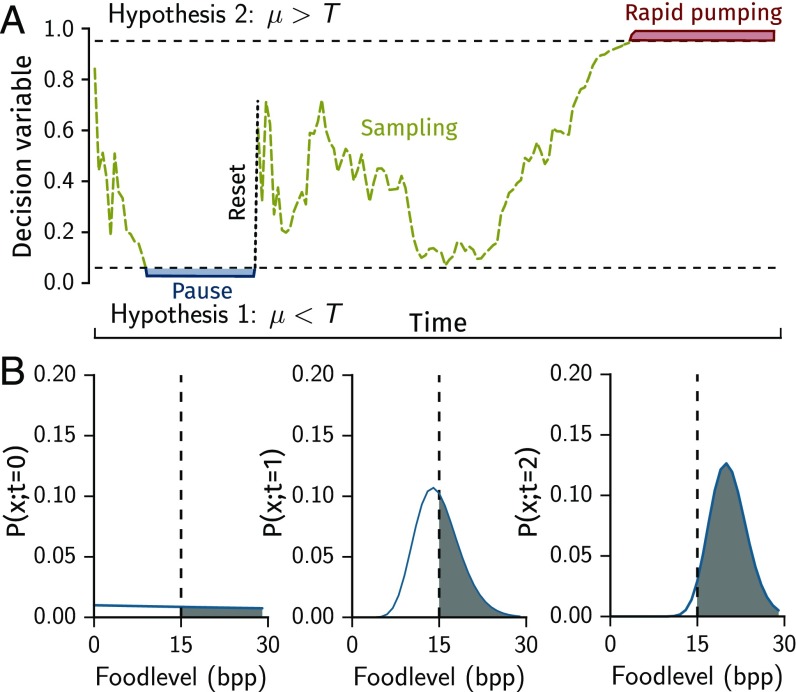
Sampling continues until either or , where the thresholds and set the level of confidence with which the alternative hypothesis is rejected (Fig. 3A, dashed black lines). An exemplary time evolution of the DV and is illustrated in Fig. 3 A and B. The initial prior is set such that neither threshold criterion is fulfilled. For simplicity, we take . We note that for Poisson-distributed samples this procedure is equivalent to a uniformly most powerful statistical test (21).
Fig. 3.
A decision theory-based model for adaptive feeding. (A) Schematic evolution of the DV in time. (B) Evolution of the belief function with samples. Dashed line represents bpp. The gray area shows the value of the DV. The dashed line indicates the cost . Graphs are from simulations at food level 20 bpp.
Committed.
In the committed phase the worm takes the action implied by the hypothesis of choice for a finite duration. The duration of the commitment is drawn from an exponential distribution with mean if the action of choice is to pump and if it is to pause.
Resetting.
In the wild, an animal should expect the environment to be dynamic. To enable adaptation to changes in the environment the animal needs to keep reevaluating its decision once the commitment step is concluded. In our model, we do this by resetting to the initial prior by assigning and . All information gathered from previous samples is thus erased and our model does not include long-term memory or learning (see Discussion).
It should be noted that in our model at any given time a worm may be sampling, committed to pumping, or pausing. However, when observing the time trace of pumping one can only discern pumping from pausing. Thus, the duration of a burst of pumping observed experimentally may be composed of two parts that cannot be distinguished: sampling and commitment. The burst duration distribution is therefore directly affected by the distribution of sampling periods.
Simulating the model.
The pumping time series has an inherent physiological timescale set by the maximal speed of the pump. Therefore, the procedure described above can be naturally simulated in a discrete-time framework (Materials and Methods). For a maximum rate of Hz, each time step of the model corresponds to 167 ms of real time. We define the optimal energy gain as the result of a hypothetical perfect series of decisions made by a worm fully aware of the ambient food concentration. In each simulation we evaluated the performance of the simulated worm by comparing to this optimum.
The Required Confidence Level Affects Performance When Resources Are Scarce.
The threshold used to make a decision determines the number of required experimental observations (pumps). A stringent decision process defined by a small value of requires prolonged sampling before committing and reduces the number of wrong decisions. Conversely, larger values of shorten the sampling process, which can prevent excess pumping at low densities but increases the chances of erroneous decisions.
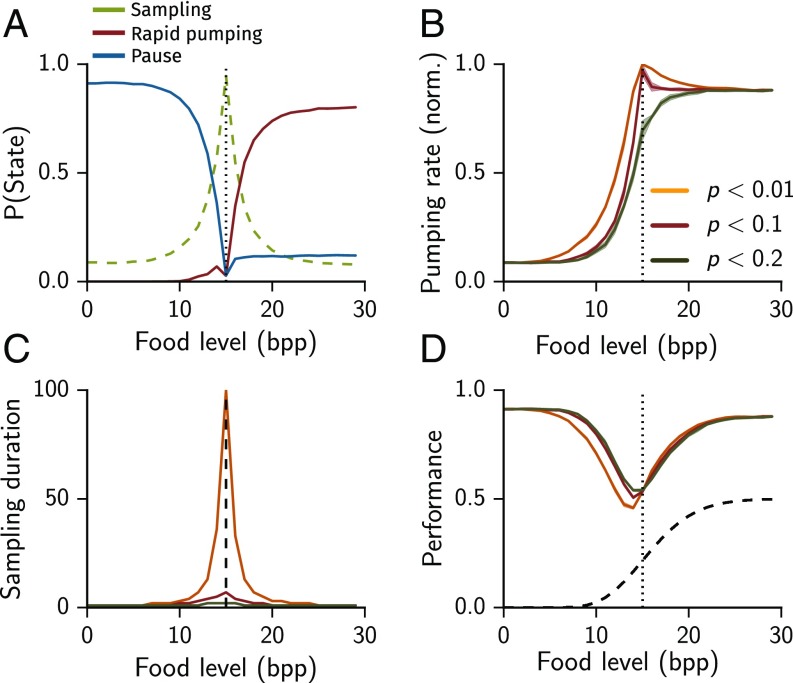
To quantitatively address this trade-off between the accuracy and speed of decision making we simulated our model with several values of , using the default parameter values in Table S2 and a range of constant food concentrations ( to bacteria per liquid volume of a single pump). When the concentration of available food was similar to the threshold , the time spent in the sampling state was longest. In all feeding environments the model switched from mostly pausing to mostly rapid pumping when the concentration of food exceeded the cost (Fig. 4A). For stringent (small) values of the pumping rate was maximized near the threshold (Fig. 4B), where the worm spent considerable time on sampling (Fig. 4C). At higher or lower food concentrations the time spent on sampling was suppressed. Indeed, the pumping rate approaches 1 at as becomes smaller. We note that in previous experiments no such maximum was observed, suggesting that C. elegans may follow a less-stringent rule (3, 4).
Table S2.
Default model parameters
| Parameter | Value |
| Cost | 15 bpp |
| Initial value of decision variable | 0.14 |
| Initial parameters of the prior | 1, 100 bpp |
| Mean rapid pumping duration | 10 time steps |
| Mean pause duration | 10 time steps |
| Reset duration | 1 time step |
| Confidence level | 0.1 |
Fig. 4.
Decision model response to food concentration. (A) Fraction of time spent in sampling, committed, and pausing states for a stringency of . (B) Pumping rate as a function of food concentration. (C) Duration of the sampling state for stringency. (D) Performance (fraction of correct decisions) as a function of food concentration. For comparison the performance of a random model with a 50% chance of pumping at every time step (black dashed line).
We termed the decisions to pump (pause) “correct” when the resulting food intake satisfied (). We then defined the performance of the model as the average fraction of correct decisions. The decision model outperformed a random model (with a 50% chance of pumping at each time step) at all food levels (Fig. 4D). High confidence levels (p) reduced performance at low food levels, , but did not affect it when food availability was higher, . The coincidence of sampling and feeding produces asymmetric effects on performance because prolonged sampling is wasteful in harsh environments but inconsequential in plentiful ones.
Resetting Is Important in Fluctuating Environments.
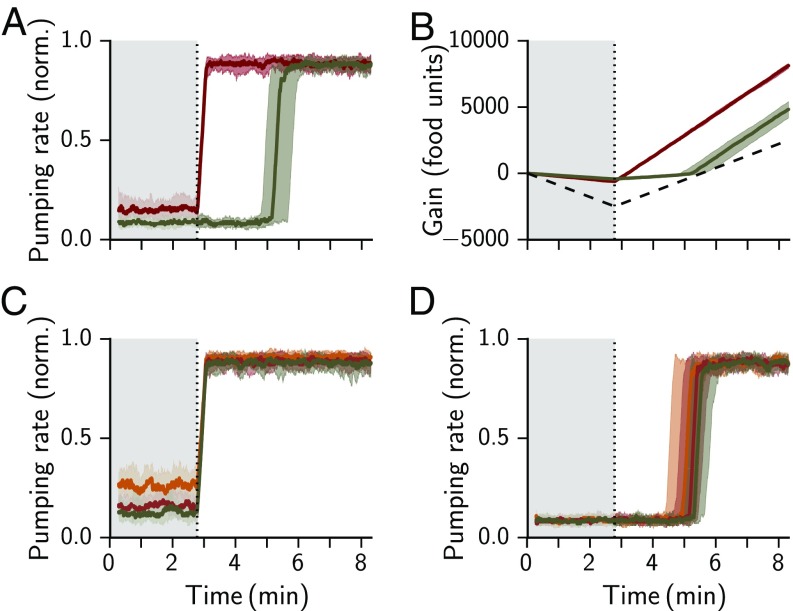
Feeding landscapes can be dynamic and spatially heterogeneous (22–24). The concatenation of decision processes naturally takes into account the fact that the environment may change. Therefore, we asked how the structure of our model affects responses to changes in food availability. Since many of our parameters merely set a timescale, we focused on the role of resetting. We compared the full model with a reduced version, where the prior parameters and were not reset to their initial values after the commitment step. The two models were simulated in the presence of a step increase in available food, from below- to above-threshold levels. Two differences are apparent. At the low food concentration, the nonresetting model developed a high accuracy. Consequently, sampling was minimized and wasteful pumping was reduced. However, when food became plentiful, the nonresetting model lagged in responding to the change: the high confidence in what became a wrongfully bleak estimate resulted in a drawn-out sampling process and slow detection of the change. After the step increase in food availability the suppression of pumping was unproductive and inferior to the full model (Fig. 5 A and B). The duration of the lag was not sensitive to changes in the confidence level required for decision, , suggesting that the latter is more important when external dynamics are slow (Fig. 5 C and D). These results (and similar results for an abrupt food decrease, see Fig. S2) show that the resetting step serves to confer flexibility and assist the adaptation response to an abrupt environmental change. In spatially heterogeneous or temporally dynamic environments resetting would positively affect the net energy balance and thus the overall fitness.
Fig. 5.
Resetting improves adaptive feeding in a dynamic environment. (A) Pumping rate in response to a step increase in mean food level from 10 to 20 units, for a model with and without resetting (red and olive, respectively). The step happens at (dashed line and after shading). The shaded area shows the SD as calculated from 30 simulated trials. (B) Cumulative net food intake (gain) over the simulated time. The width of the curve indicates the SD as calculated from 30 simulated trials. A random model with a 50% chance of pumping performs worse (dashed black line). (C) Response of the full model to a step in food level from 10 to 20 units for stringency , 0.1, and 0.2 (yellow, red, and olive, respectively). (D) Response of the nonresetting model to a step in food level from 10 to 20 units for stringency , 0.1, and 0.2 (yellow, red, and olive, respectively). Each time step in the stimulation represents 1/6 s.
Fig. S2.
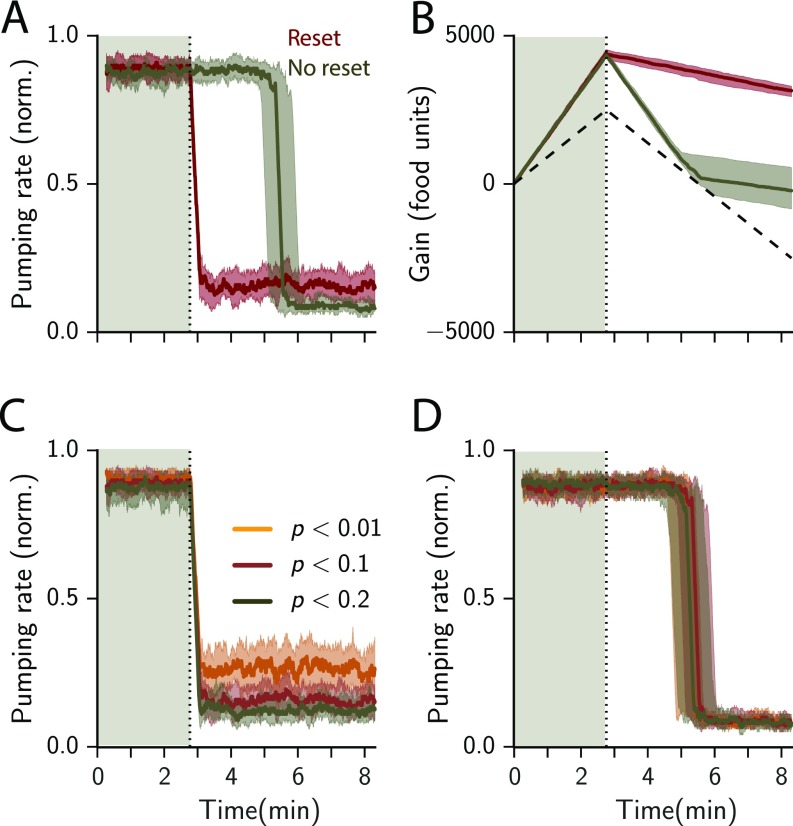
Resetting improves adaptive feeding in a dynamic environment. (A) Pumping rate in response to a step decrease in mean food level from 20 to 10 units for a model with and without resetting (red and olive, respectively). The step happens at (dashed line and after shading). The shaded area shows the SD as calculated from 30 simulated trials. (B) Cumulative net food intake (gain) over the simulated time. The width of the curve indicates the SD as calculated from 30 simulated trials. A random model with a 50% chance of pumping performs worse (dashed black line). (C) Response of the full model to a step in food level from 20 to 10 units for stringency (yellow, red, and olive, respectively). (D) Response of the nonresetting model to a step in food level from 20 to 10 units for stringency (yellow, red, and olive, respectively). Each time step in the stimulation represents 1/6 s.
Food Oscillations Evoke Stochastic Switching.
To gain insight into feeding behavior in a fluctuating environment we considered oscillating food levels. If the period of these oscillations is very slow, one may expect that the feeding dynamics of animals would track these oscillations well, which is the optimal solution in terms of net energy gain. In contrast, the response to fast oscillations can take different forms, from time-invariant response to the time-average of the food concentration to oscillatory or chaotic response.
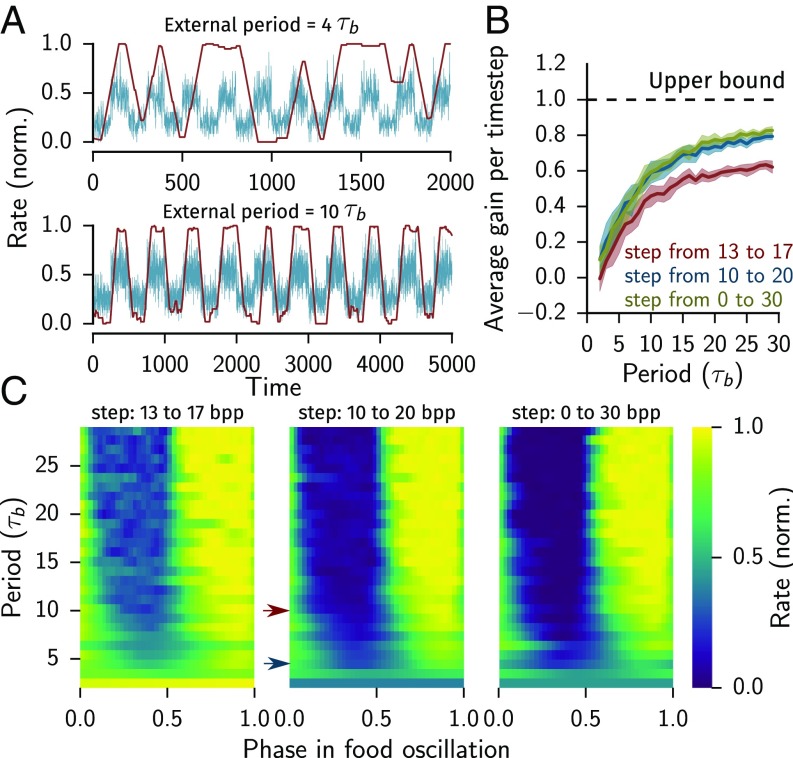
We simulated our model with environments where the concentration of food oscillated between and , with and , or bacteria. Fast oscillations with respect to the timescales of bursts and pauses, and , resulted in partial or no tracking of the periodic stimulus (Fig. 6A). In particular, the combination of a short period and small amplitude yielded continuous pumping (yellow stripe at periods shorter than in Fig. 6C). This likely reflects the inability of the worm to complete the sampling process and commit to a decision. Very slow oscillations were perfectly tracked, as expected. When the amplitude was not too low, the model achieved of perfect performance (Fig. 6B). Given resetting, this was optimal: the cost of starting to sample from the prior accounted for the missing . This indicates that a soft reset that partially retains the gathered information could improve performance. The reduced performance at lower amplitudes can be attributed to the fact that the decision problem in this case is harder and requires more sampling.
Fig. 6.
Feeding in a dynamic environment depends on the timescale of change. (A) Pumping response to periodic low-to-high food steps with a fast and slow period compared with the committed and pause lengths () and instantaneous food level (red and blue, respectively). (B) Fraction of food gained per bite (normalized to the theoretical maximum). (C) Periodogram showing the average pumping rate in response to periodic steps from 13 to 17, 10 to 20, and 0 to 30 (). The location of the trajectories shown in A is indicated as blue and red arrows (top and bottom of A, respectively). The committed and pause durations for all panels are .
In contrast, at intermediate periods substantially slower than and we observed stochastic switching between tracking and nontracking. In Fig. 6C, good tracking of the oscillatory stimulus manifests as a clear distinction between the light and the dark parts of the heat maps. The transition between stochastic switching and good tracking occurs near a period of .
These model predictions are strongly supported by our recent experimental measurement of pumping dynamics in oscillating environments (4). These results show that C. elegans do not track oscillations of food concentration perfectly, even when these oscillations are slower than the typical duration of a burst. Rather, they switch between tracking and nontracking modes on a timescale of s, in strong agreement with the dynamics predicted by the model.
Discussion
In this paper we propose that bursty feeding dynamics stem from the need to acquire both energy and information. For C. elegans we assume that the mechanical act of pumping bacteria into the pharyngeal lumen is economical only when the number of bacteria captured exceeds a threshold, which depends on their nutritional content. However, instead of pumping strictly when expecting the reward to exceed the threshold, we propose that worms also pump when the outcome is uncertain. Gaining information by pumping necessitates the ability to sense and estimate the nutritional value of a single volume of the pharyngeal lumen. Yet our model is indifferent to the mechanisms used for this estimate, which may depend on mechanical and chemical cues.
Decision making has long been described as a statistical inference problem in which animals collect information about the environment until a decision can be reached (25). Our model sequentially repeats a generic decision cycle, in which a sampling period is followed by a finite commitment to either feed or pause. We formulate and analyze our model in the framework of sequential analysis. This framework is particularly useful when the starting point of the decision process is well-defined, the statistics of the incoming information are stable, and the timescale over which information accrues can be identified. These conditions are not guaranteed to be satisfied in neural circuits which routinely exhibit adaptation, nonlinear responses, and refractory periods. However, they are satisfied by the time series of pumping events: The size of each sample is dictated by the properties of the pharynx and its timing is directly observable (3, 4, 6). We can thus identify the starting point of each decision cycle unambiguously as the end of a long pause or of a burst of fast pumping.
The decision process described here involves trade-offs. First, the accuracy of the decisions is determined by the stopping criterion and measured as the frequency of correct decisions. Increasing it requires longer sampling. This is known as the speed–accuracy trade-off (26, 27). The sampling procedure considered in our model, which can be viewed as a biased diffusion of the DV between two absorbing boundaries, strikes an optimal balance between speed and accuracy (28). Second, the duration of the commitment period (set by and ) manifests as an explore–exploit trade-off (14, 27, 29–31). While an animal aims to maximize (in the short term) the benefit from the knowledge obtained from recent measurements, exploitation makes it hard to respond to a change in the environment. Despite its simplicity, this model provides mechanisms for tuning these characteristic trade-offs.
Resetting the prior at the end of each cycle allows flexibility in responding to abrupt dynamical changes or to patchy environments. Alternative strategies for coping with heterogeneous environment have been proposed, for example, in bacteria and worms (32–35). It is expected that the significance of resetting is diminished if changes to the environment are slow or smooth. In our model, we assume that after resetting the worm returns to a constant prior. This prior can be encoded genetically and epigenetically and therefore can change on evolutionary or generational time scales. Moreover, it is known that food preference and feeding are learned behaviors that can be modulated by life history (19, 36). Correspondingly, the parameters and which characterize the prior may be changing on time scales that extend multiple rounds of decision. Our model can therefore be incorporated into a multiscale model which includes the effect of learning and evolutionary adaptation.
We have assumed that pumping in the sampling state occurs at the same rate as pumping during bursts ( Hz), which is only limited by pharyngeal physiology. Physiological limits on the speed of sampling are known to be important for determining animal sampling strategies (25, 37). However, additional factors may contribute to the choice of sampling rate. For example, the size of individual samples is correlated with the amount of information they provide. Animals with a larger pharynx could reduce their sampling frequency. Moreover, a high sampling frequency may produce highly correlated consecutive samples. This would reduce the information gained per pump. Indeed, we have observed that in many cases worms pump more irregularly and somewhat slower before initiating bursts of continuous rapid pumping (3, 4).
Finally, the framework we develop here provides a starting point for investigating more elaborate and realistic scenarios, theoretically and experimentally. In particular, it is interesting to understand how the mechanisms described here extend to heterogeneous environments, and how they are adapted to long-term environmental changes. Microfluidic approaches are particularly suitable for addressing such questions experimentally (38), and the framework of sequential analysis is well-suited to develop them theoretically (39–41).
Materials and Methods
Pumping Experiments.
C. elegans adults were loaded into the WormSpa microfluidic device. An overnight culture of Escherichia coli OP50 was spun down and resuspended in NGM buffer. The culture was concentration-adjusted to a given optical density () and flown through the microfluidic device at 5 L/min. After an hour of acclimation in the device, the animals were imaged for 30 min at a magnification of 4 and 62.5 frames per second. Pumping events were identified using a custom Python script which aligned and subtracted consecutive images and calculated the entropy of the difference image. A pumping event results in a characteristic spike in this entropy (4). The data in Figs. 1 and 2 A and B are reproduced from ref. 4.
Simulations.
The simulations were implemented in Python 2.7. At the start, the prior is initialized with the values given in Table S2 (unless otherwise indicated). To get a time series of the feeding decisions, we use a discrete time approach. At each time step , we draw a food value from a Poisson distribution with mean . The change of the DV is then calculated using the update rules given in ref. 4. At each time step we assess whether a decision can be made or sampling continues by using the built-in numerical integration of the Gamma function to obtain the value of or . If a decision is made, we draw a commitment time from an exponential distribution of mean or , depending on the decision. When the commitment is finished, we reset the DV and restart the process.
Animal-to-Animal Variation in Feeding Behavior
Despite the genetic similarity between individuals in an isogenetic population, we observed animal-to-animal variability in feeding behavior (Fig. S1). From each animal’s pumping time series we calculated burst durations and the mean pumping rate over the whole trajectory. The burst duration of individual animals is correlated with the mean pumping rate (Table S1). These correlations indicate that the variability in pumping dynamics seen in Fig. 1 could arise from heterogeneity in the animal population. These differences correlate with a parameter of the decision process: the average duration of the commitment step (Table S1). It is interesting to ask to what extent are the decision parameters are genetically encoded as opposed to tuned by adaptation and learning. The values of these parameters influence the prior estimate of the environment and the tuning of different trade-offs. If the behavior of a single animal over time remains constant then animal-to-animal variability would indicate weak regulation or perhaps a population-wide diversification strategy. In contrast, adapting to external changes within the range of observed behaviors can contribute to the fitness of the individual.
Default Model Parameters
Unless otherwise noted in the main text all simulations of the model were done with the standard parameters given in Table S2.
Resetting Is Important in Fluctuating Environments
We compare the response of the full model and a model without resetting (the prior parameters and remain unchanged after the commitment step). We present the models with a step decrease in food concentration (from 20 to 10 bpp). Similar to the response observed when the food level increases, we observe a key difference between the two models: While the nonresetting model intitially performs similarly, it lags in responding to the change in food availability (Fig. S2A). Therefore, the net food intake is less than that of the full model (Fig. 2B). Similar to the step increase, the lag time does not depend on the required confidence level (Fig. S2 C and D).
Acknowledgments
This work was supported by NSF Grants PHY-1205494 and MCB-1413134 (to E.L.), IOS 1256989 (to D.B.), and PHY-130554 (to A.R.D.) and a Howard Hughes Medical Institute International Student Research Fellowship (to M.S.).
Footnotes
The authors declare no conflict of interest.
This article is a PNAS Direct Submission. T.E. is a guest editor invited by the Editorial Board.
This article contains supporting information online at www.pnas.org/lookup/suppl/doi:10.1073/pnas.1703958114/-/DCSupplemental.
References
- 1.Hill JO, Peters JC. Environmental contributions to the obesity epidemic. Science. 1998;280:1371–1374. doi: 10.1126/science.280.5368.1371. [DOI] [PubMed] [Google Scholar]
- 2.Woods SC, Schwartz MW, Baskin DG, Seeley RJ. Food intake and the regulation of body weight. Annu Rev Psychol. 2000;51:255–277. doi: 10.1146/annurev.psych.51.1.255. [DOI] [PubMed] [Google Scholar]
- 3.Lee KS, et al. Serotonin-dependent kinetics of feeding bursts underlie a graded response to food availability in C. elegans. Nat Commun. 2017;8:14221. doi: 10.1038/ncomms14221. [DOI] [PMC free article] [PubMed] [Google Scholar]
- 4.Scholz M, Lynch DJ, Lee KS, Levine E, Biron D. A scalable method for automatically measuring pharyngeal pumping in C. elegans. J Neurosci Methods. 2016;274:172–178. doi: 10.1016/j.jneumeth.2016.07.016. [DOI] [PubMed] [Google Scholar]
- 5.Itskov PM, et al. Automated monitoring and quantitative analysis of feeding behaviour in Drosophila. Nat Commun. 2014;5:4560. doi: 10.1038/ncomms5560. [DOI] [PMC free article] [PubMed] [Google Scholar]
- 6.Lockery SR, et al. A microfluidic device for whole-animal drug screening using electrophysiological measures in the nematode C. elegans. Lab Chip. 2012;12:2211–2220. doi: 10.1039/c2lc00001f. [DOI] [PMC free article] [PubMed] [Google Scholar]
- 7.Ratcliff R, Cherian A, Segraves M. A comparison of macaque behavior and superior colliculus neuronal activity to predictions from models of two-choice decisions. J Neurophysiol. 2003;90:1392–1407. doi: 10.1152/jn.01049.2002. [DOI] [PubMed] [Google Scholar]
- 8.Audley RJ, Pike AR. Some alternative stochastic models of choice. Br J Math Stat Psychol. 1965;18:207–225. [Google Scholar]
- 9.Bogacz R, Wagenmakers E-J, Forstmann BU, Nieuwenhuis S. The neural basis of the speed–accuracy tradeoff. Trends Neurosci. 2010;33:10–16. doi: 10.1016/j.tins.2009.09.002. [DOI] [PubMed] [Google Scholar]
- 10.LaBerge D. A recruitment theory of simple behavior. Psychometrika. 1962;27:375–396. [Google Scholar]
- 11.Link SW, Heath RA. A sequential theory of psychological discrimination. Psychometrika. 1975;40:77–105. [Google Scholar]
- 12.Reddi BA, Asrress KN, Carpenter RH. Accuracy, information, and response time in a saccadic decision task. J Neurophysiol. 2003;90:3538–3546. doi: 10.1152/jn.00689.2002. [DOI] [PubMed] [Google Scholar]
- 13.Siggia ED, Vergassola M. Decisions on the fly in cellular sensory systems. Proc Natl Acad Sci USA. 2013;110:E3704–E3712. doi: 10.1073/pnas.1314081110. [DOI] [PMC free article] [PubMed] [Google Scholar]
- 14.Vergassola M, Villermaux E, Shraiman BI. ‘Infotaxis’ as a strategy for searching without gradients. Nature. 2007;445:406–409. doi: 10.1038/nature05464. [DOI] [PubMed] [Google Scholar]
- 15.Avery L, Shtonda BB. Food transport in the C. elegans pharynx. J Exp Biol. 2003;206:2441–2457. doi: 10.1242/jeb.00433. [DOI] [PMC free article] [PubMed] [Google Scholar]
- 16.Fang-Yen C, Avery L, Samuel ADT. Two size-selective mechanisms specifically trap bacteria-sized food particles in Caenorhabditis elegans. Proc Natl Acad Sci USA. 2009;106:20093–20096. doi: 10.1073/pnas.0904036106. [DOI] [PMC free article] [PubMed] [Google Scholar]
- 17.Avery L, You Y. 2012 C. elegans feeding. WormBook, ed. The C. elegans Research Community, WormBook, doi/10.1895/wormbook. 1.150. 1. Available at www.wormbook.org.
- 18.Trojanowski NF, Padovan-Merhar O, Raizen DM, Fang-Yen C. Neural and genetic degeneracy underlies Caenorhabditis elegans feeding behavior. J Neurophysiol. 2014;112:951–961. doi: 10.1152/jn.00150.2014. [DOI] [PMC free article] [PubMed] [Google Scholar]
- 19.Song BM, Faumont S, Lockery S, Avery L. Recognition of familiar food activates feeding via an endocrine serotonin signal in Caenorhabditis elegans. Elife. 2013;2:e00329. doi: 10.7554/eLife.00329. [DOI] [PMC free article] [PubMed] [Google Scholar]
- 20.Avery L. Motor neuron M3 controls pharyngeal muscle relaxation timing in Caenorhabditis elegans. J Exp Biol. 1993;175:283–297. doi: 10.1242/jeb.175.1.283. [DOI] [PubMed] [Google Scholar]
- 21.Lehmann EL, Romano JP. 2005. Testing Statistical Hypotheses. Springer Texts in Statistics (Springer, New York), 3rd Ed, p 68.
- 22.McCann KS, Rasmussen J, Umbanhowar J. The dynamics of spatially coupled food webs. Ecol Lett. 2005;8:513–523. doi: 10.1111/j.1461-0248.2005.00742.x. [DOI] [PubMed] [Google Scholar]
- 23.Durham WM, et al. Turbulence drives microscale patches of motile phytoplankton. Nat Commun. 2013;4:2148. doi: 10.1038/ncomms3148. [DOI] [PubMed] [Google Scholar]
- 24.Baker MAA, Brown JS. Foraging in space and time structure an African small mammal community. Oecologia. 2014;175:521–535. doi: 10.1007/s00442-014-2926-6. [DOI] [PubMed] [Google Scholar]
- 25.Gold JI, Shadlen MN. The neural basis of decision making. Annu Rev Neurosci. 2007;30:535–574. doi: 10.1146/annurev.neuro.29.051605.113038. [DOI] [PubMed] [Google Scholar]
- 26.Chittka L, Skorupski P, Raine NE. Speed–accuracy tradeoffs in animal decision making. Trends Ecol Evol. 2009;24:400–407. doi: 10.1016/j.tree.2009.02.010. [DOI] [PubMed] [Google Scholar]
- 27.Barack DL, Gold JI. Temporal trade-offs in psychophysics. Curr Opin Neurobiol. 2016;37:121–125. doi: 10.1016/j.conb.2016.01.015. [DOI] [PMC free article] [PubMed] [Google Scholar]
- 28.Bogacz R, Brown E, Moehlis J, Holmes P, Cohen JD. The physics of optimal decision making: A formal analysis of models of performance in two-alternative forced-choice tasks. Psychol Rev. 2006;113:700–765. doi: 10.1037/0033-295X.113.4.700. [DOI] [PubMed] [Google Scholar]
- 29.Sutton RS, Barto AG. Reinforcement Learning: An Introduction. MIT Press; Cambridge, MA: 1998. [Google Scholar]
- 30.Cohen JD, McClure SM, Yu AJ. Should I stay or should I go? How the human brain manages the trade-off between exploitation and exploration. Philos Trans R Soc Lond B Biol Sci. 2007;362:933–942. doi: 10.1098/rstb.2007.2098. [DOI] [PMC free article] [PubMed] [Google Scholar]
- 31.Humphries NE, Sims DW. Optimal foraging strategies: Lévy walks balance searching and patch exploitation under a very broad range of conditions. J Theor Biol. 2014;358:179–193. doi: 10.1016/j.jtbi.2014.05.032. [DOI] [PubMed] [Google Scholar]
- 32.Celani A, Vergassola M. Bacterial strategies for chemotaxis response. Proc Natl Acad Sci USA. 2010;107:1391–1396. doi: 10.1073/pnas.0909673107. [DOI] [PMC free article] [PubMed] [Google Scholar]
- 33.Clausznitzer D, Micali G, Neumann S, Sourjik V, Endres RG. Predicting chemical environments of bacteria from receptor signaling. PLoS Comput Biol. 2014;10:e1003870. doi: 10.1371/journal.pcbi.1003870. [DOI] [PMC free article] [PubMed] [Google Scholar]
- 34.Iwanir S, et al. Serotonin promotes exploitation in complex environments by accelerating decision-making. BMC Biol. 2016;14:9. doi: 10.1186/s12915-016-0232-y. [DOI] [PMC free article] [PubMed] [Google Scholar]
- 35.Greene JS, et al. Balancing selection shapes density-dependent foraging behaviour. Nature. 2016;539:254–258. doi: 10.1038/nature19848. [DOI] [PMC free article] [PubMed] [Google Scholar]
- 36.Calhoun AJ, Chalasani SH, Sharpee TO. Maximally informative foraging by Caenorhabditis elegans. Elife. 2014;3:e04220. doi: 10.7554/eLife.04220. [DOI] [PMC free article] [PubMed] [Google Scholar]
- 37.Uchida N, Kepecs A, Mainen ZF. Seeing at a glance, smelling in a whiff: Rapid forms of perceptual decision making. Nat Rev Neurosci. 2006;7:485–491. doi: 10.1038/nrn1933. [DOI] [PubMed] [Google Scholar]
- 38.Ben-Yakar A, Chronis N, Lu H. Microfluidics for the analysis of behavior, nerve regeneration, and neural cell biology in C. elegans. Curr Opin Neurobiol. 2009;19:561–567. doi: 10.1016/j.conb.2009.10.010. [DOI] [PMC free article] [PubMed] [Google Scholar]
- 39.Nassar MR, Wilson RC, Heasly B, Gold JI. An approximately Bayesian delta-rule model explains the dynamics of belief updating in a changing environment. J Neurosci. 2010;30:12366–12378. doi: 10.1523/JNEUROSCI.0822-10.2010. [DOI] [PMC free article] [PubMed] [Google Scholar]
- 40.Behrens TE, Woolrich MW, Walton ME, Rushworth MF. Learning the value of information in an uncertain world. Nat Neurosci. 2007;10:1214–1221. doi: 10.1038/nn1954. [DOI] [PubMed] [Google Scholar]
- 41.Tartakovsky AG. On asymptotic optimality in sequential changepoint detection: Non-iid case. IEEE Trans Inf Theory. 2015;63:3433–3450. [Google Scholar]


