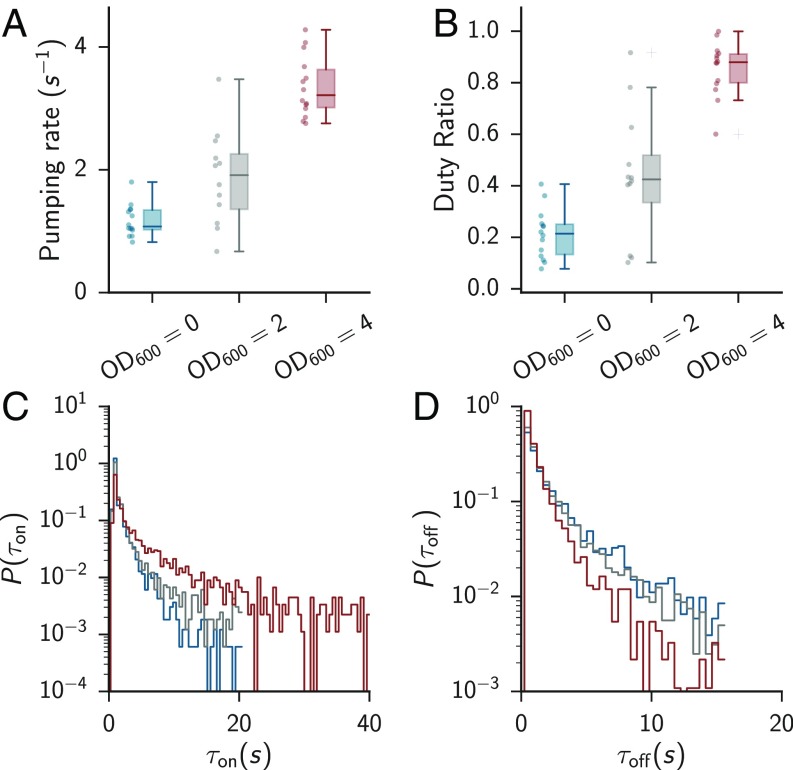
Fig. 2.
C. elegans feeding is a stochastic process. (A) Pumping rate as a function of food level. Error bars denote 5th and 95th percentiles. The boxes show the upper and lower quartiles. , 12, and 14 for food levels of 0, 2, and 4, respectively. (B) Duty ratio (fraction of rapid pumping) as a function of food level. The duty ratio was defined as the fraction of time during which consecutive pumps were 500 ms apart. Error bars show th and th percentiles. (C and D) Duration of bursts and pauses for the three food levels. Bursts are defined as series of continuous pumps 500 ms apart. Colors are the same as in A and B. A and B are reproduced from data presented in ref. 4.

